

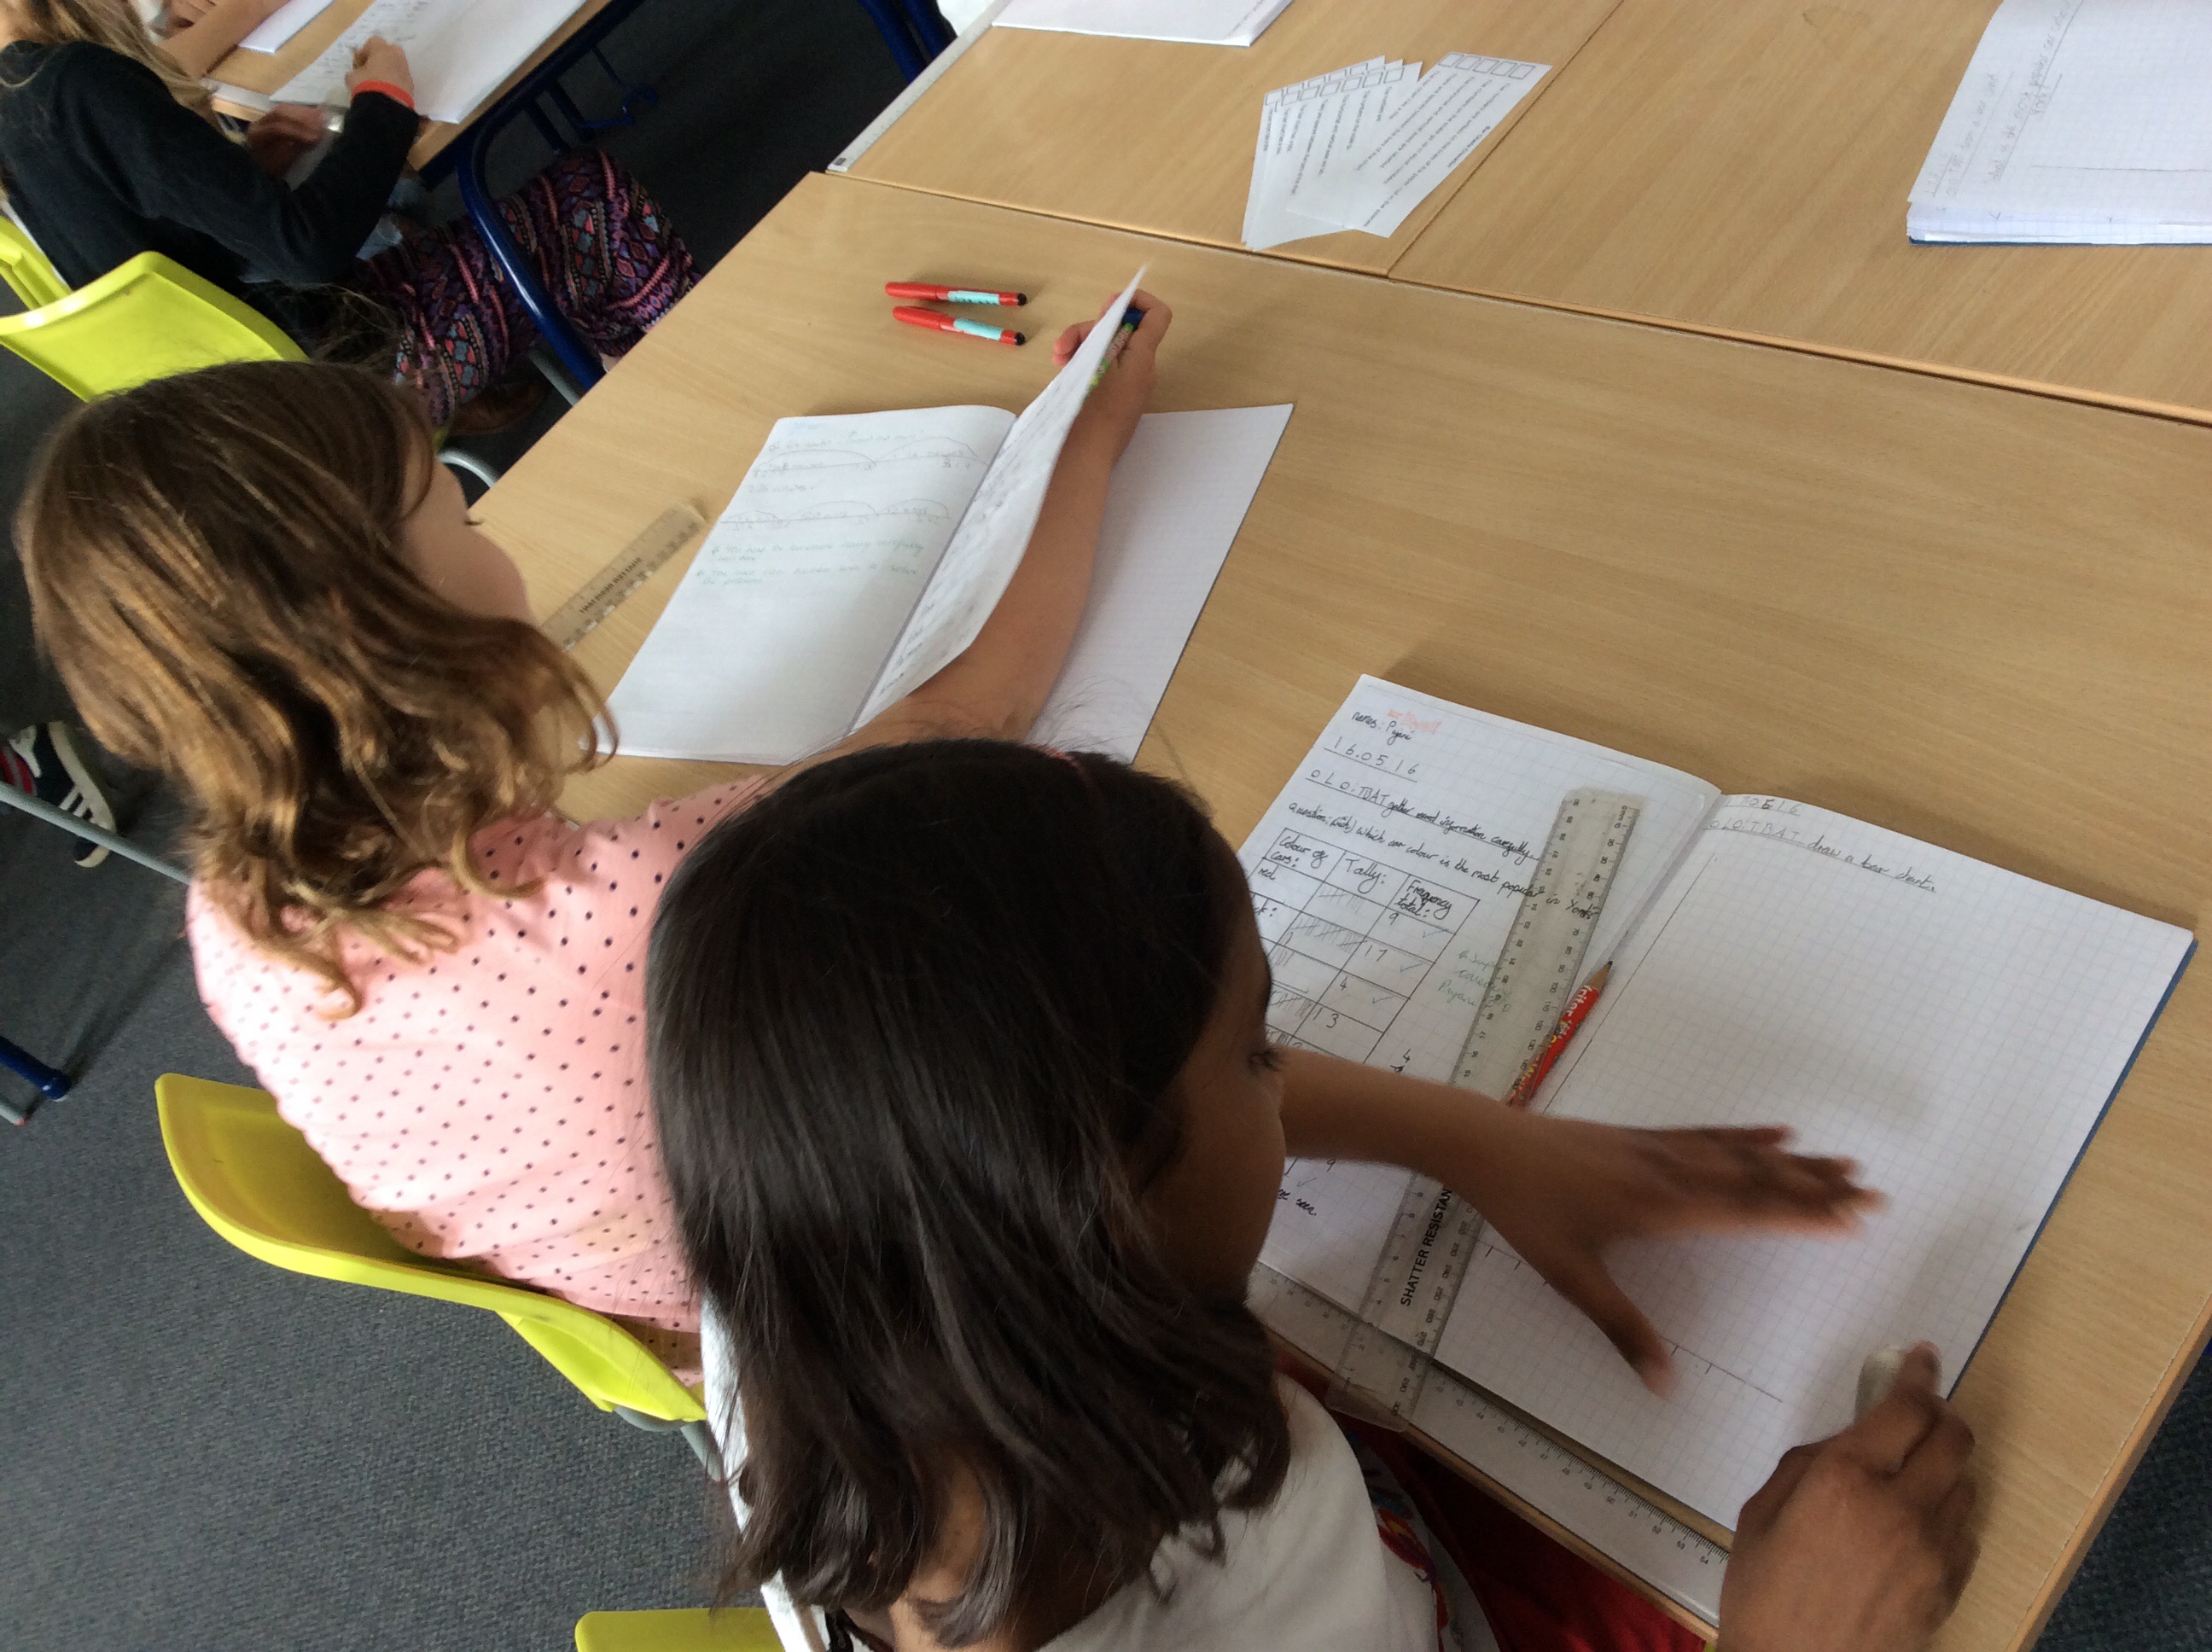
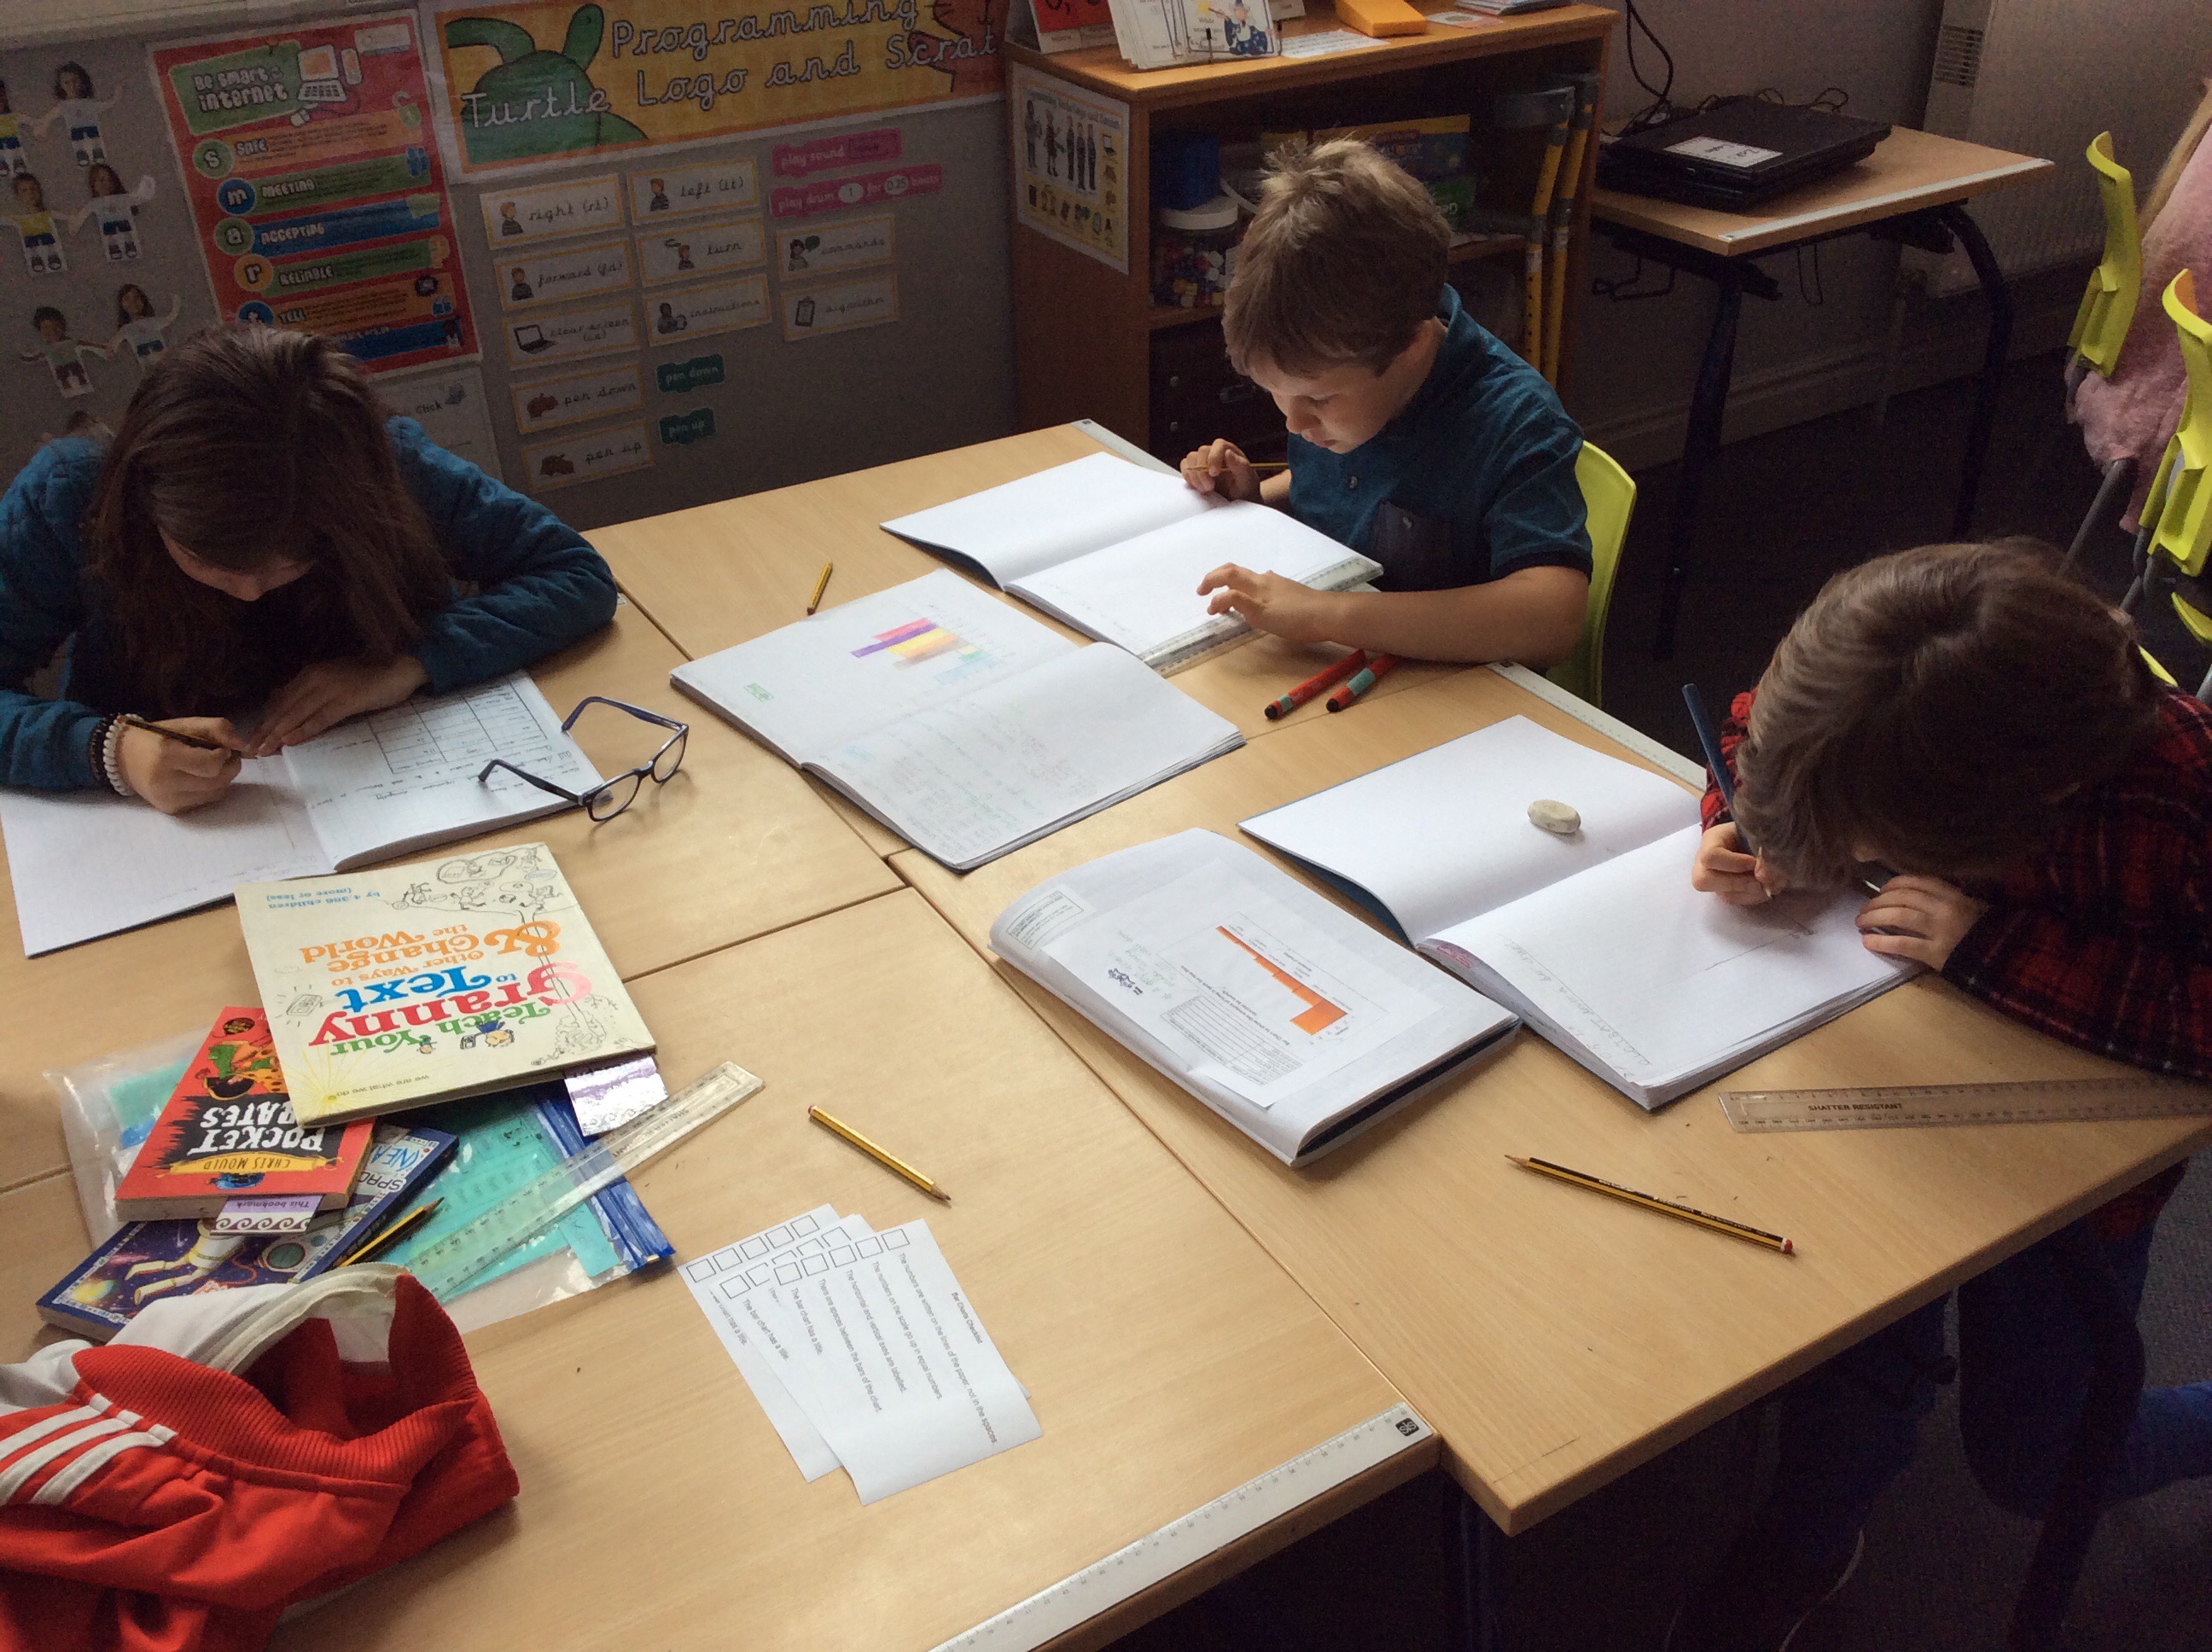
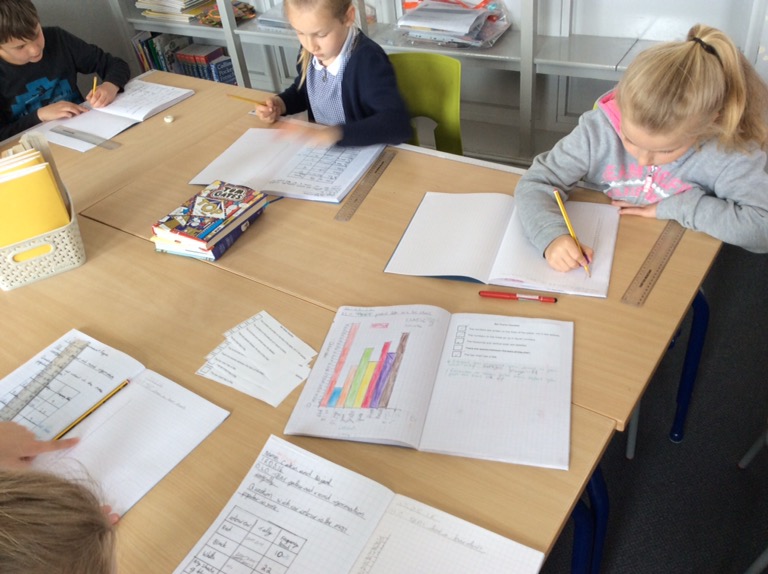
We have revisited data handling this week and used the data we collected about popular car colour to draw a bar chart to show our results. This is something we have learnt about earlier in the year and so many of us were really confident drawing our charts.

I love doing bar charts