
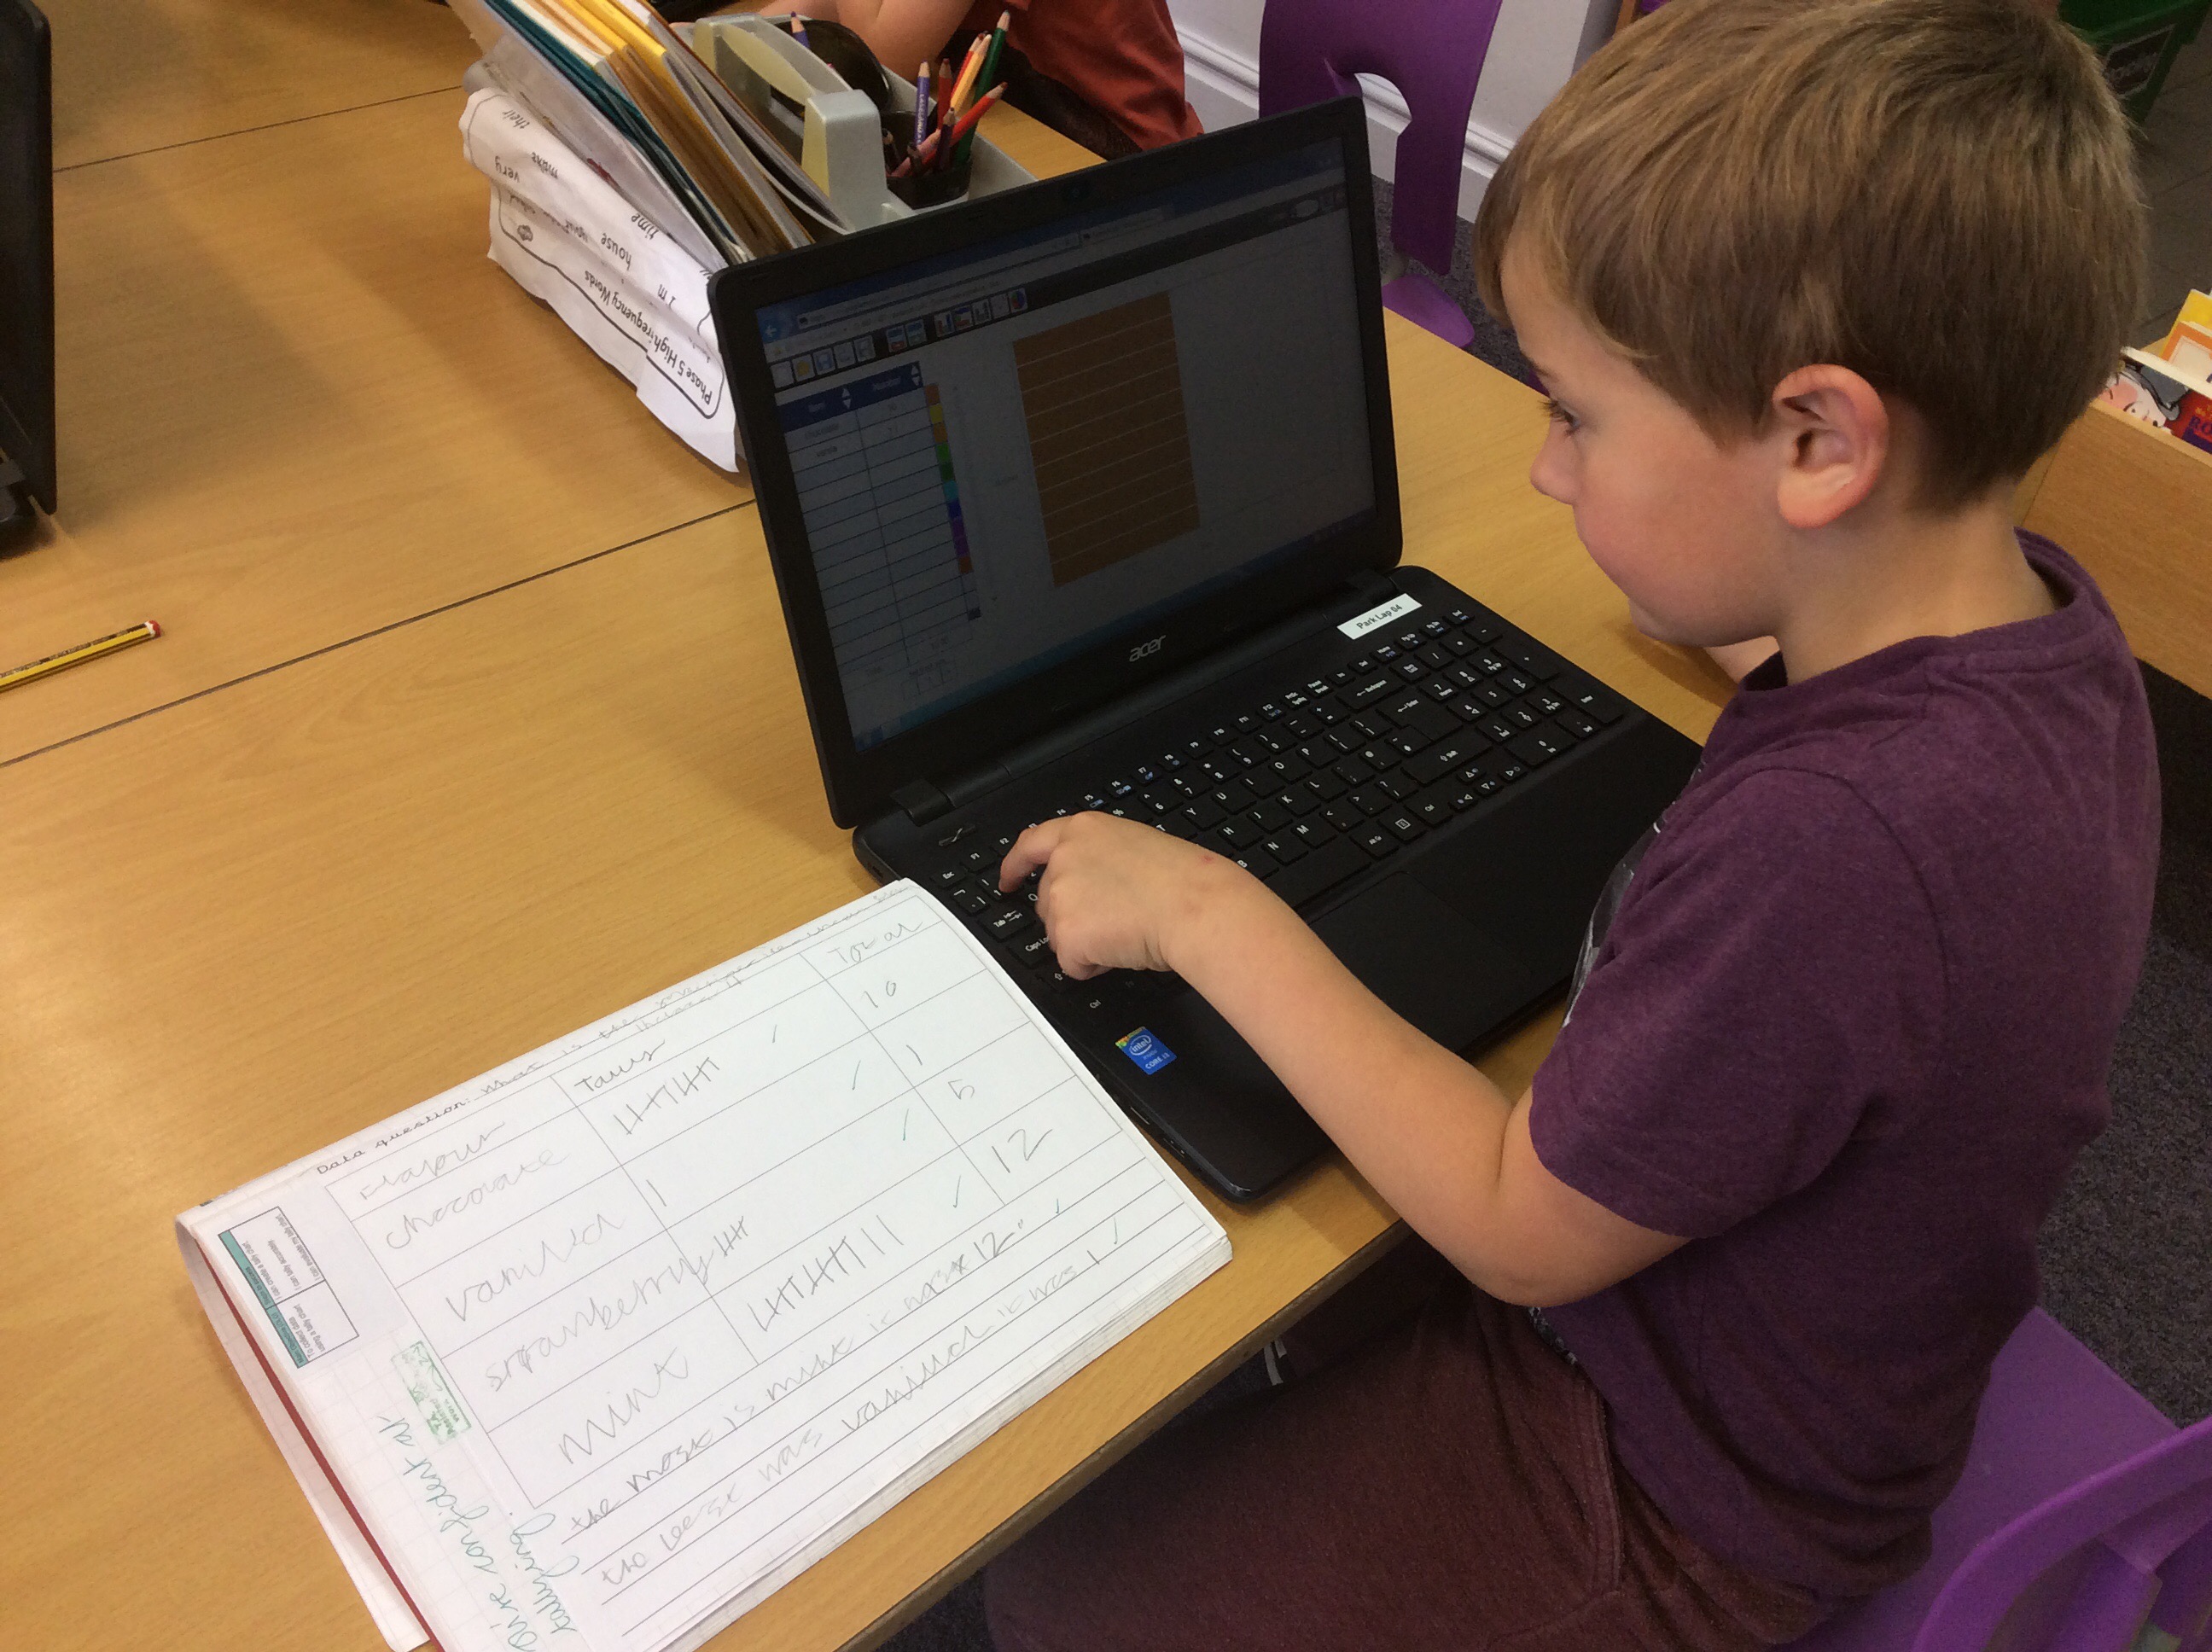
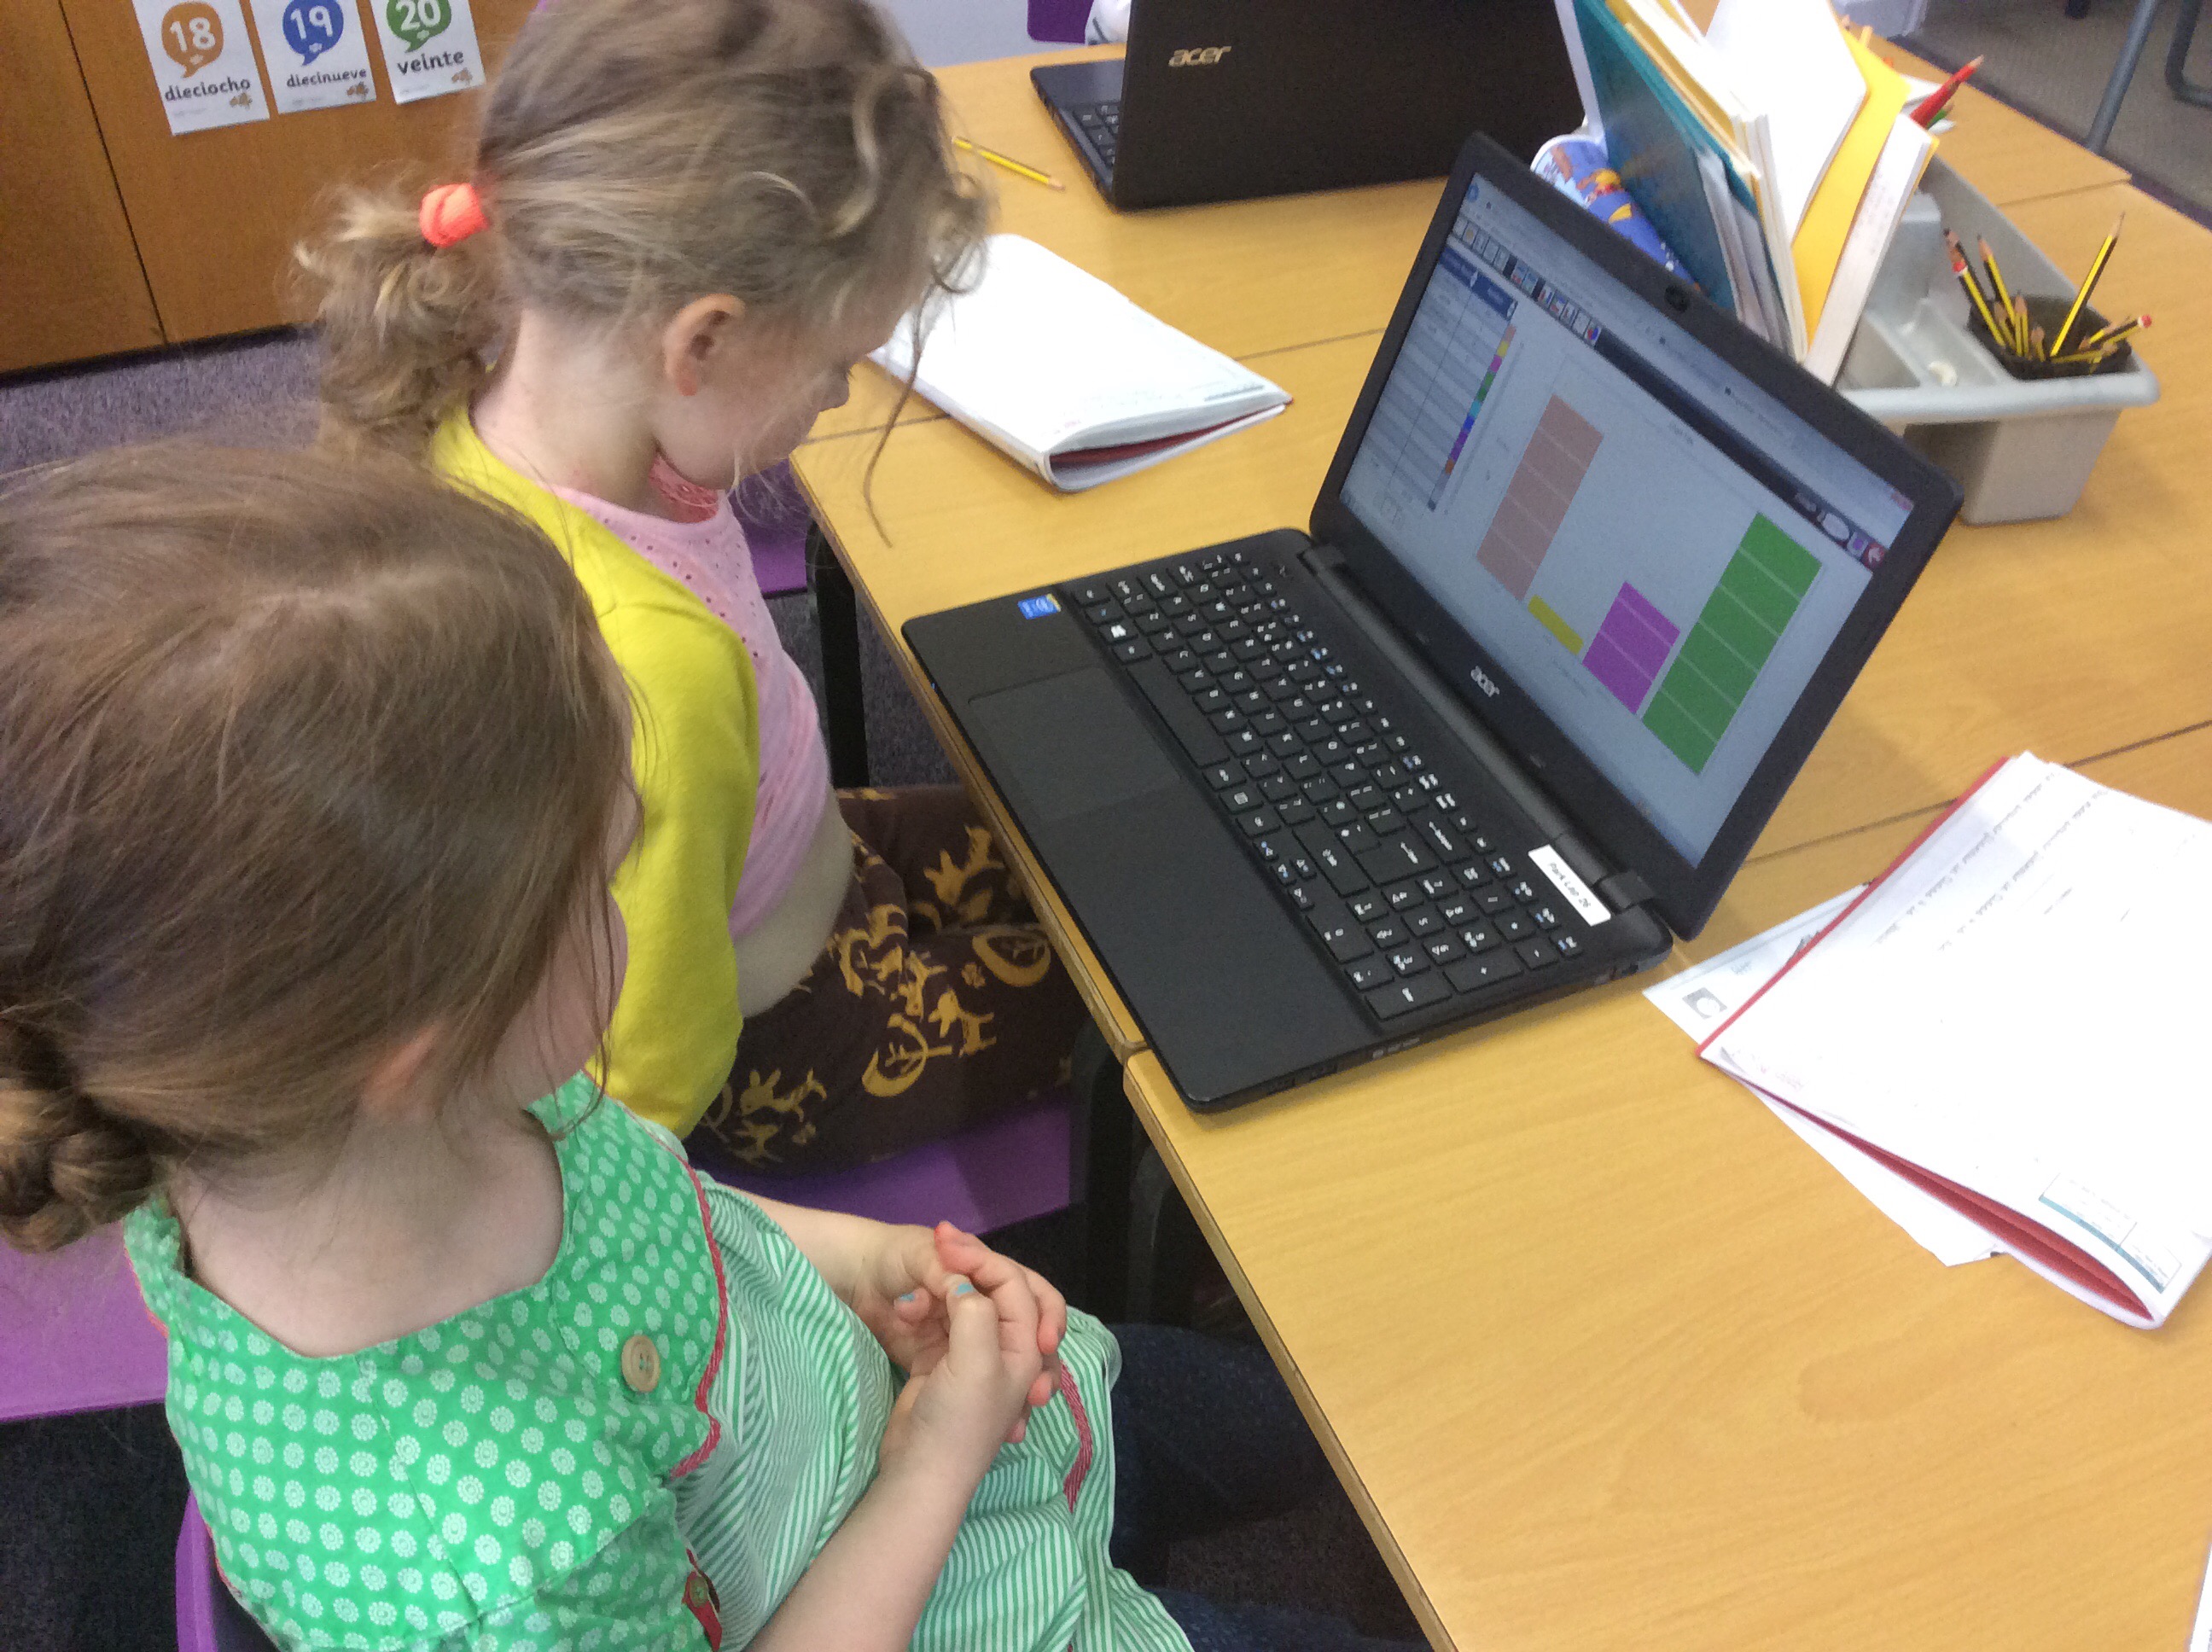
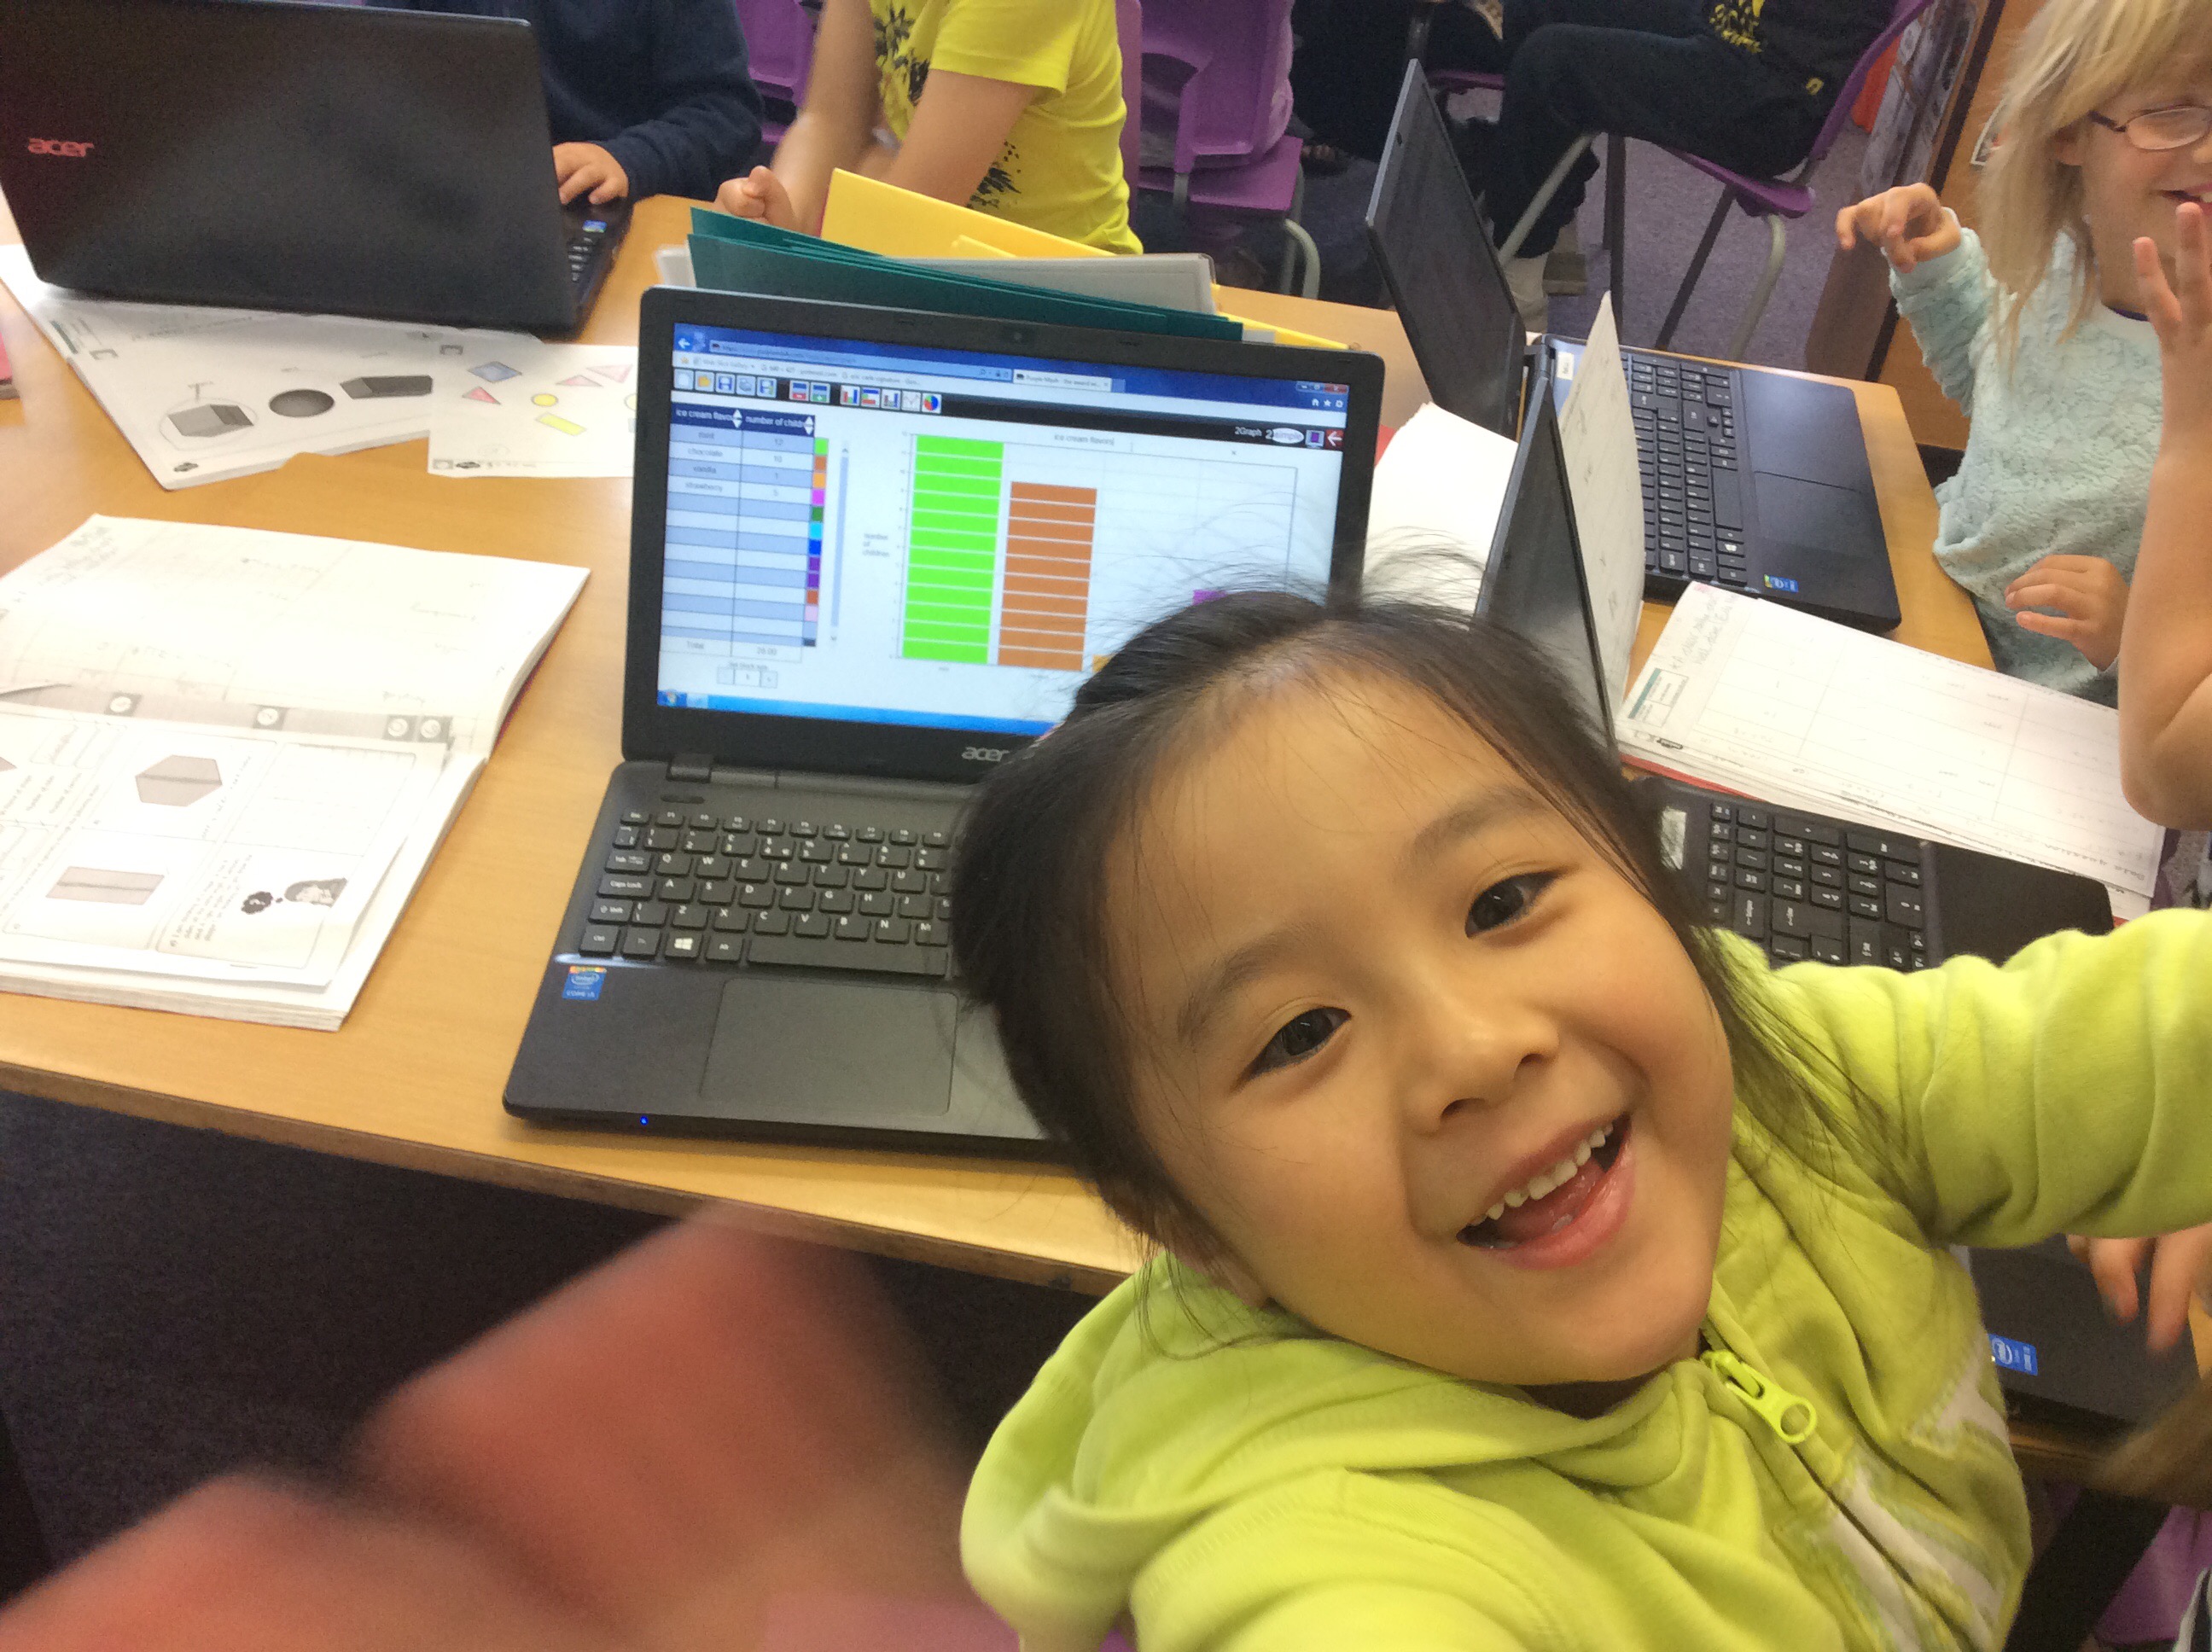
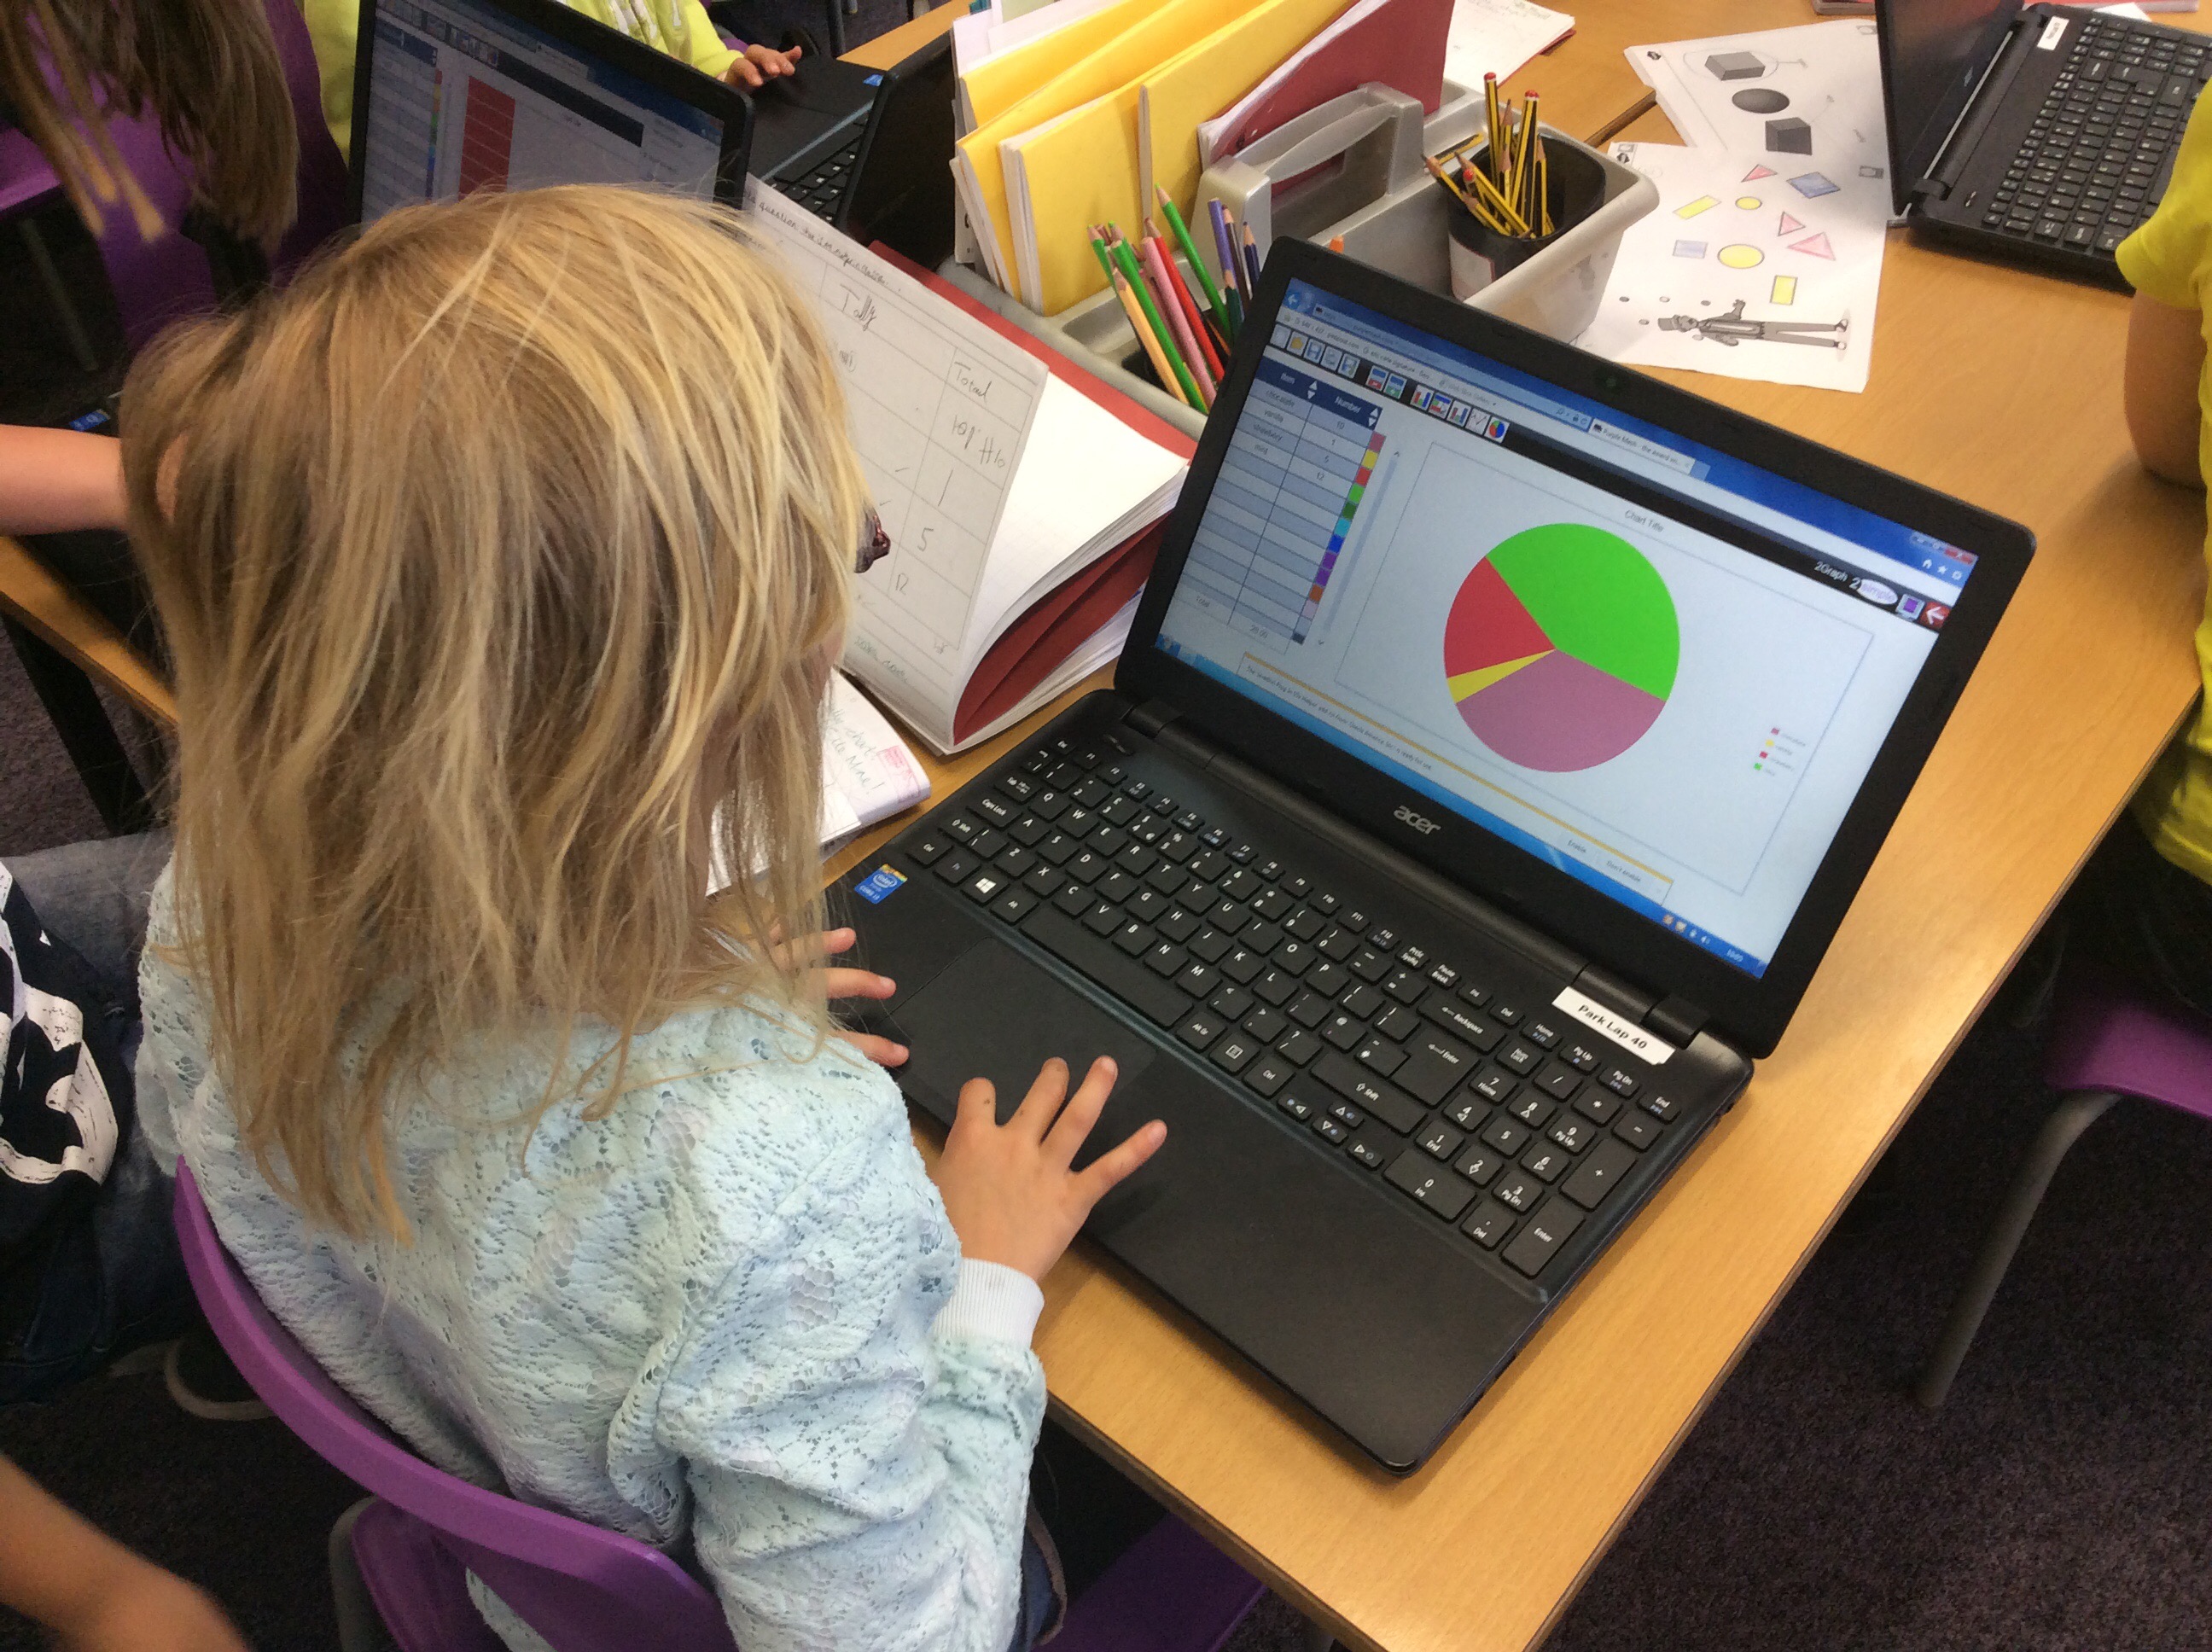
We used the laptops to create our own bar charts to display our results from last week’s data collection lesson. It was really fun experimenting on 2Graph to transfer our tally information to different bars. We were also able to view our results as a pie chart and a line graph too. After the lesson, we evaluated how effective we had been by discussing if we had chosen appropriate colours for the ice-cream flavours and whether or not we had remembered to label the graph correctly. 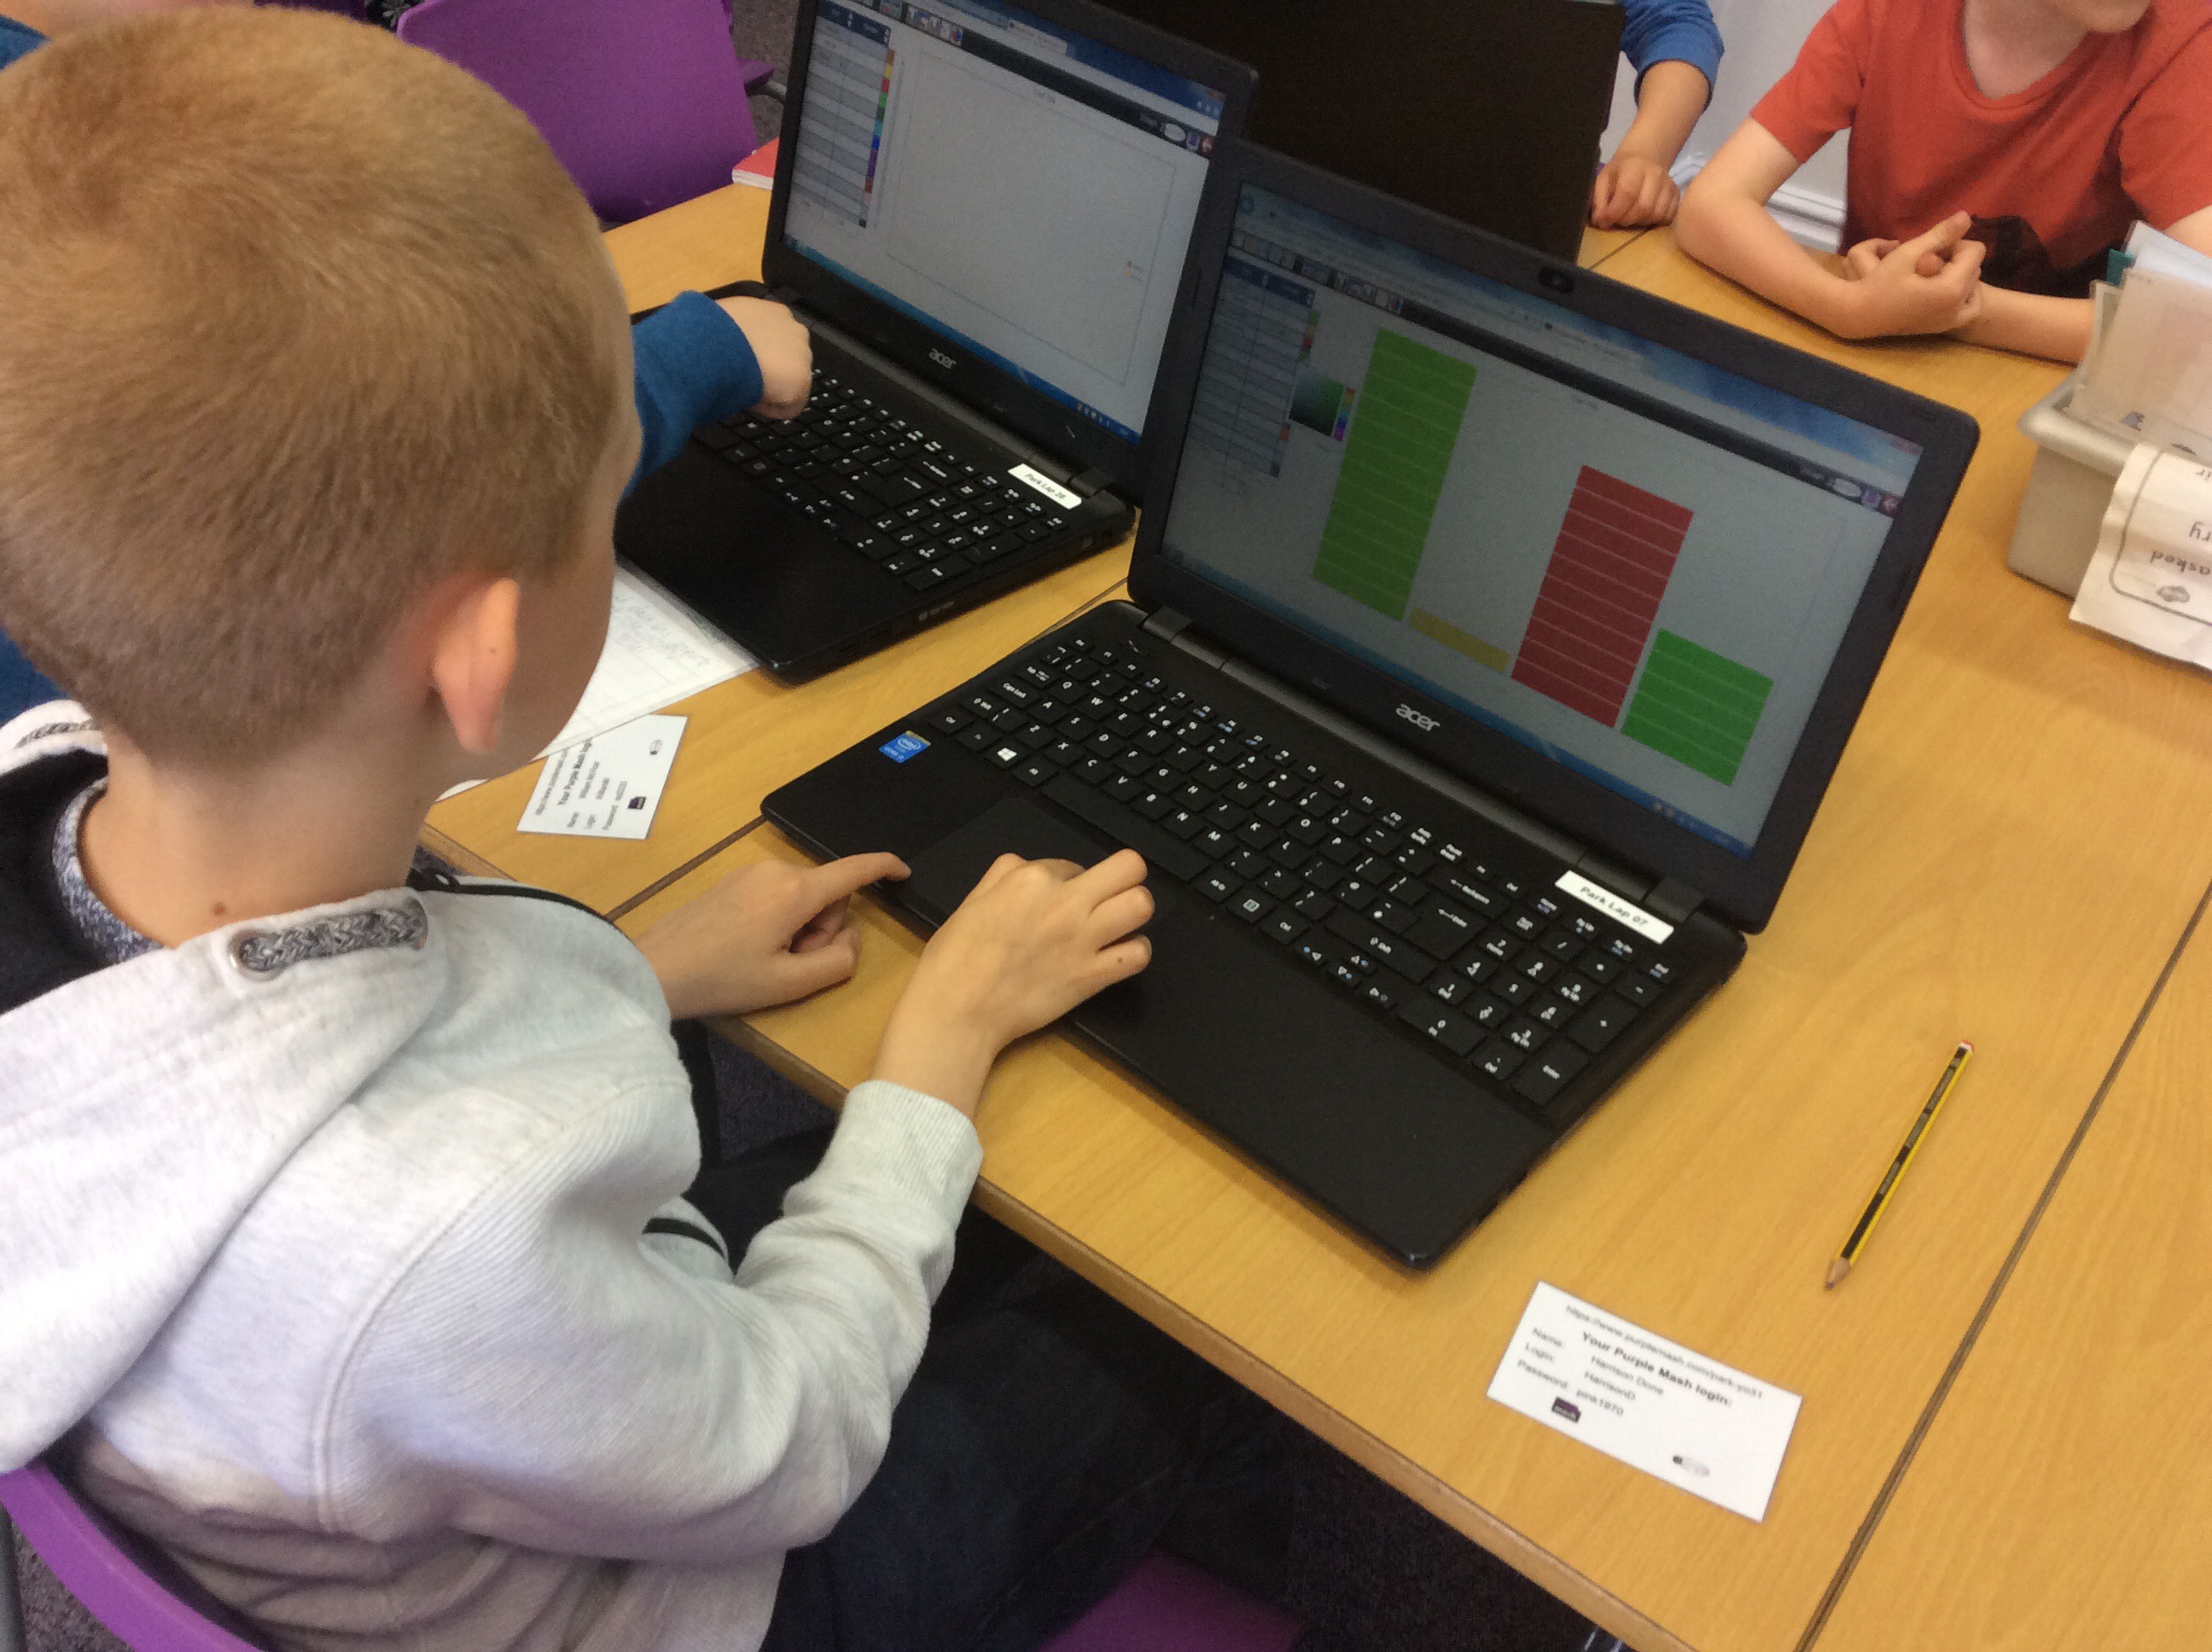

- Home
- Key Info
- Our School
- Calendar
- Teaching & Learning
- Curriculum
- National Curriculum
- New Reception Starters
- Rainbow Hub
- Blue Class Information (Year 1/2)
- Green Class Information (Year 1/2)
- Lime Class Information (Year 3/4)
- Maroon Class Information (Year 3/4)
- Indigo Class Information (Year 4/5)
- Magenta Class Information (Year 5/6)
- Turquoise Class Information (Year 5/6)
- Parents
- Partnerships
- Ebor Academy Trust
- Contact Us
