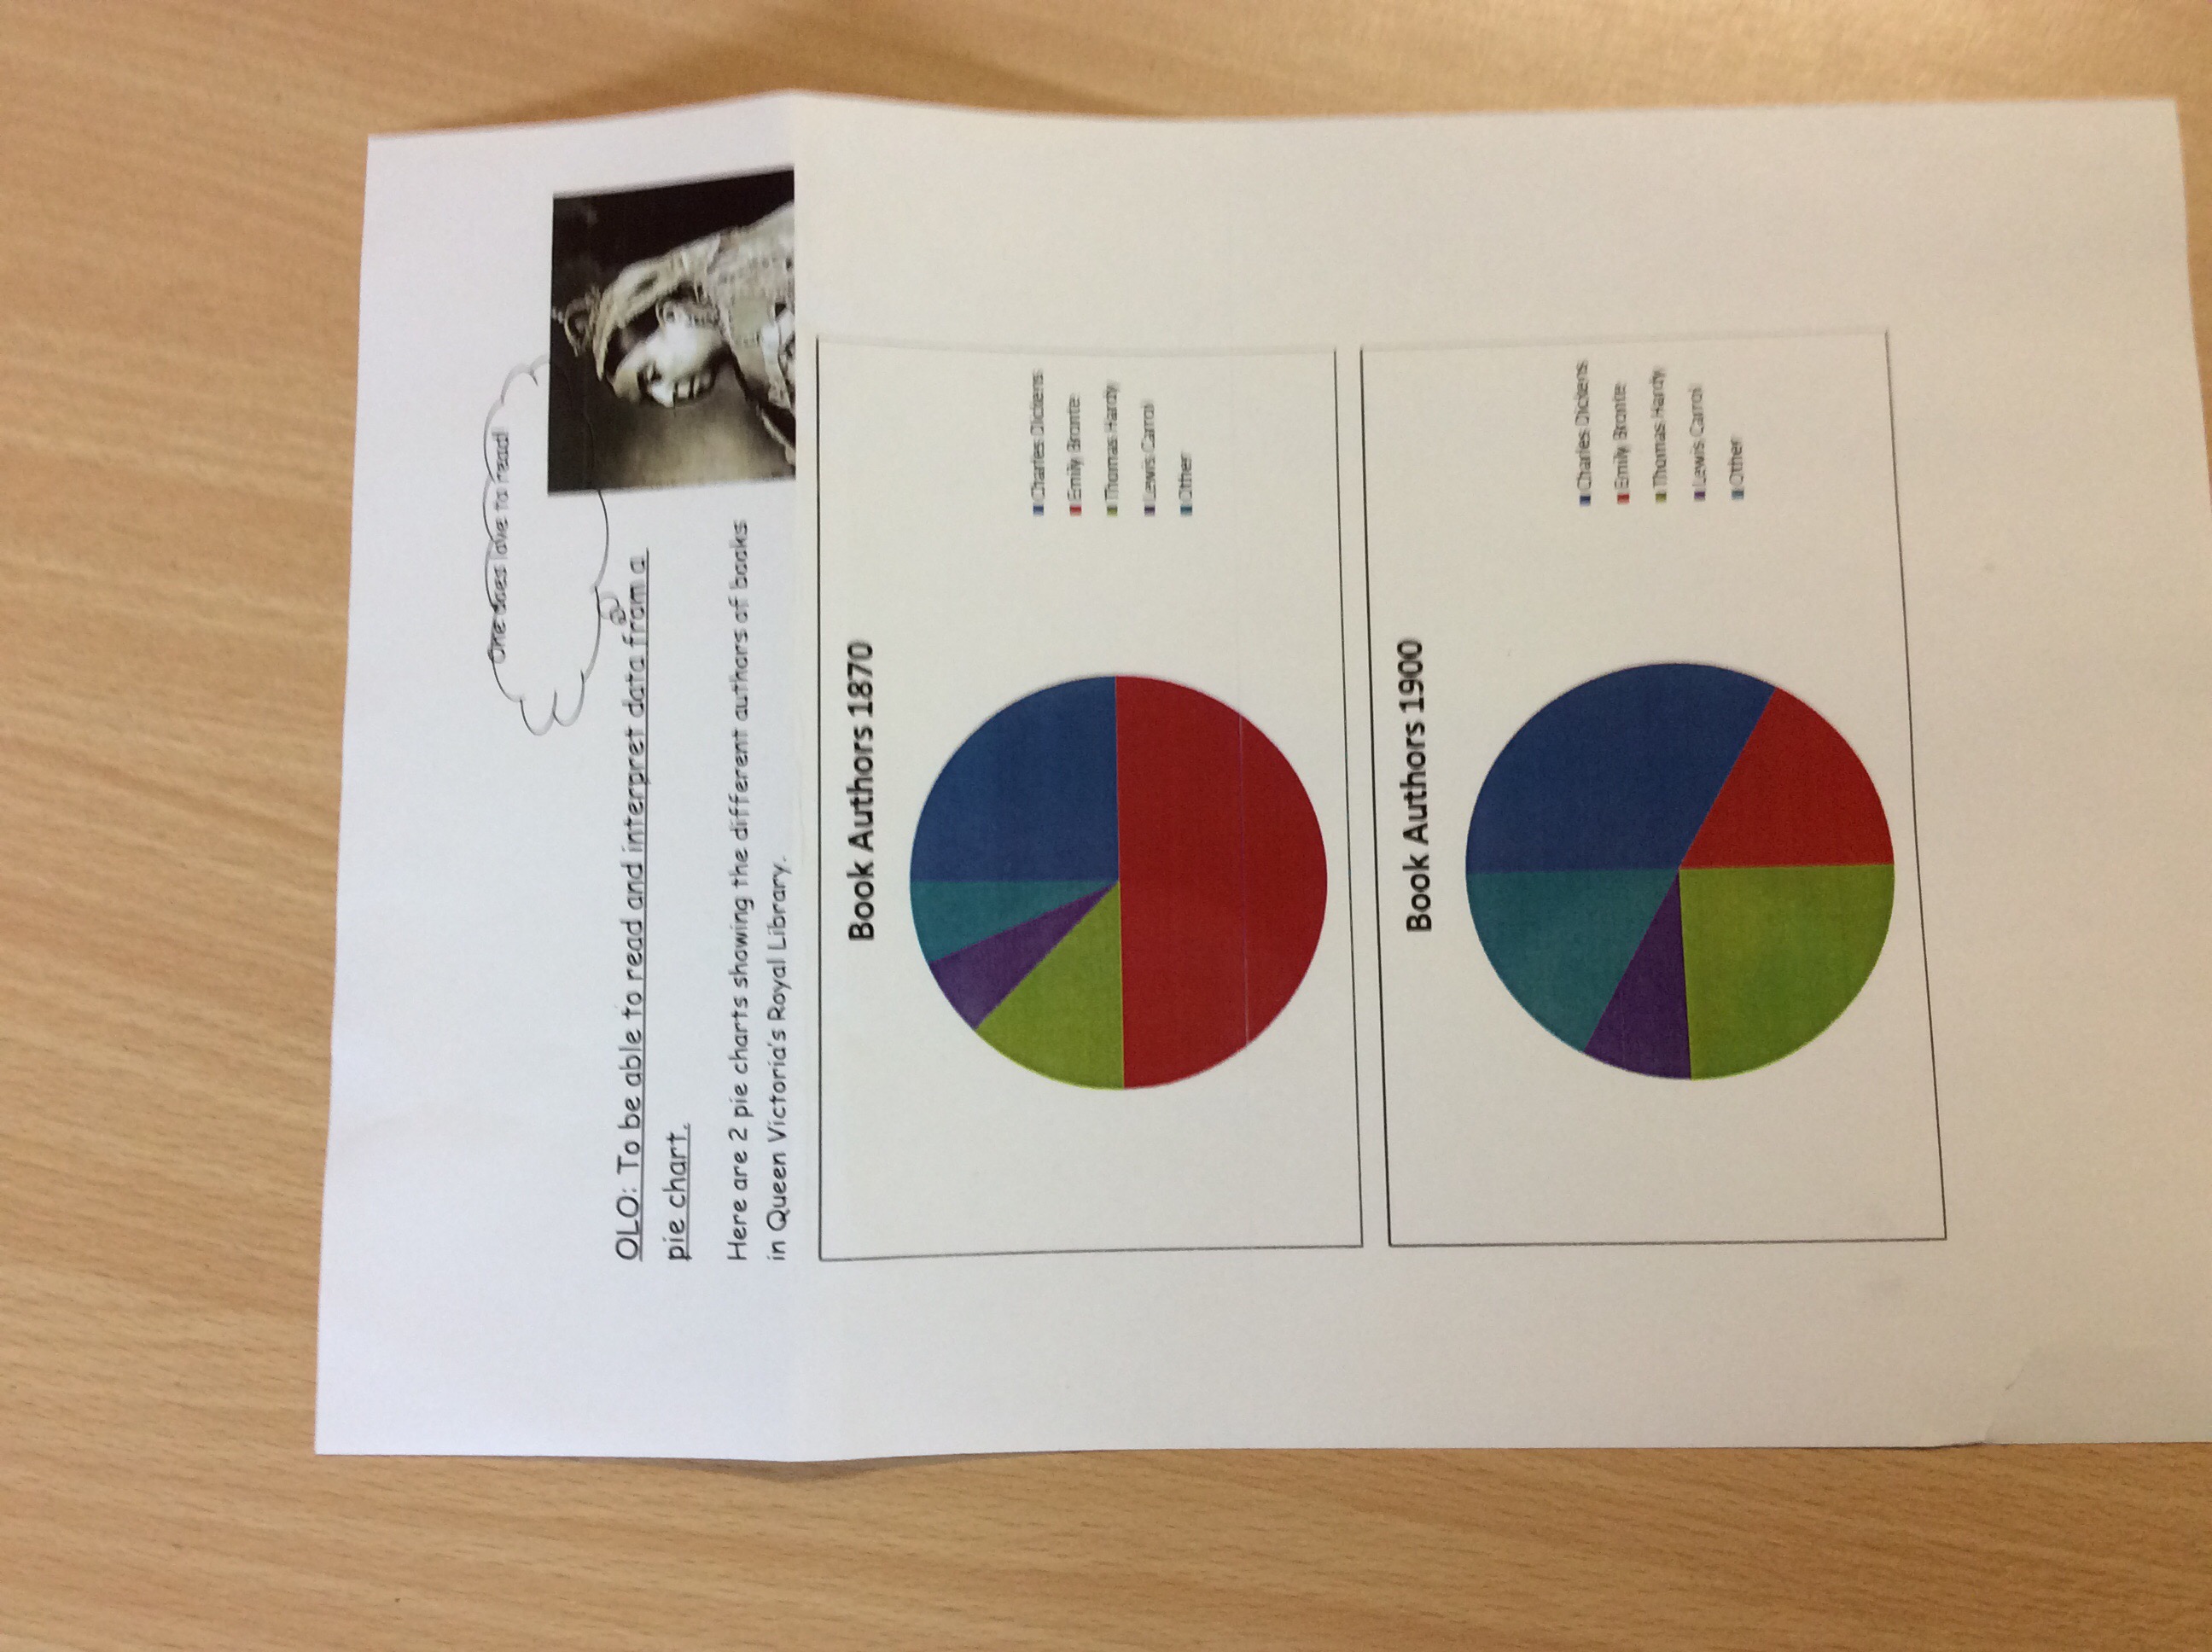
We have been reading and interpreting data about authors in Victorian times from a range of pie charts. The class applied their equivalences learning on Monday to help give answers as fractions and percentages accurately.


We have been reading and interpreting data about authors in Victorian times from a range of pie charts. The class applied their equivalences learning on Monday to help give answers as fractions and percentages accurately.
| Cookie | Duration | Description |
|---|---|---|
| cookielawinfo-checkbox-advertisement | 1 year | Set by the GDPR Cookie Consent plugin, this cookie is used to record the user consent for the cookies in the "Advertisement" category . |
| cookielawinfo-checkbox-analytics | 11 months | This cookie is set by GDPR Cookie Consent plugin. The cookie is used to store the user consent for the cookies in the category "Analytics". |
| cookielawinfo-checkbox-functional | 11 months | The cookie is set by GDPR cookie consent to record the user consent for the cookies in the category "Functional". |
| cookielawinfo-checkbox-necessary | 11 months | This cookie is set by GDPR Cookie Consent plugin. The cookies is used to store the user consent for the cookies in the category "Necessary". |
| cookielawinfo-checkbox-others | 11 months | This cookie is set by GDPR Cookie Consent plugin. The cookie is used to store the user consent for the cookies in the category "Other. |
| cookielawinfo-checkbox-performance | 11 months | This cookie is set by GDPR Cookie Consent plugin. The cookie is used to store the user consent for the cookies in the category "Performance". |
| CookieLawInfoConsent | 1 year | Records the default button state of the corresponding category & the status of CCPA. It works only in coordination with the primary cookie. |
| DYNSRV | session | This cookie is used for load balancing purposes to decide which server to send the visitor. |
| viewed_cookie_policy | 11 months | The cookie is set by the GDPR Cookie Consent plugin and is used to store whether or not user has consented to the use of cookies. It does not store any personal data. |
| Cookie | Duration | Description |
|---|---|---|
| CONSENT | 2 years | YouTube sets this cookie via embedded youtube-videos and registers anonymous statistical data. |
| Cookie | Duration | Description |
|---|---|---|
| NID | 6 months | NID cookie, set by Google, is used for advertising purposes; to limit the number of times the user sees an ad, to mute unwanted ads, and to measure the effectiveness of ads. |
| VISITOR_INFO1_LIVE | 5 months 27 days | A cookie set by YouTube to measure bandwidth that determines whether the user gets the new or old player interface. |
| YSC | session | YSC cookie is set by Youtube and is used to track the views of embedded videos on Youtube pages. |
| yt-remote-connected-devices | never | YouTube sets this cookie to store the video preferences of the user using embedded YouTube video. |
| yt-remote-device-id | never | YouTube sets this cookie to store the video preferences of the user using embedded YouTube video. |
| yt.innertube::nextId | never | This cookie, set by YouTube, registers a unique ID to store data on what videos from YouTube the user has seen. |
| yt.innertube::requests | never | This cookie, set by YouTube, registers a unique ID to store data on what videos from YouTube the user has seen. |

I wasn’t here for this activity but it sounds like everyone had lots of fun! 😛
I love pies and pie charts
I know a lot more about them now then I did then.
I struggled a bit but I got the hang of it. 😉 😉 :}
I struggled a bit but I got the hang of it. 😉 😉