

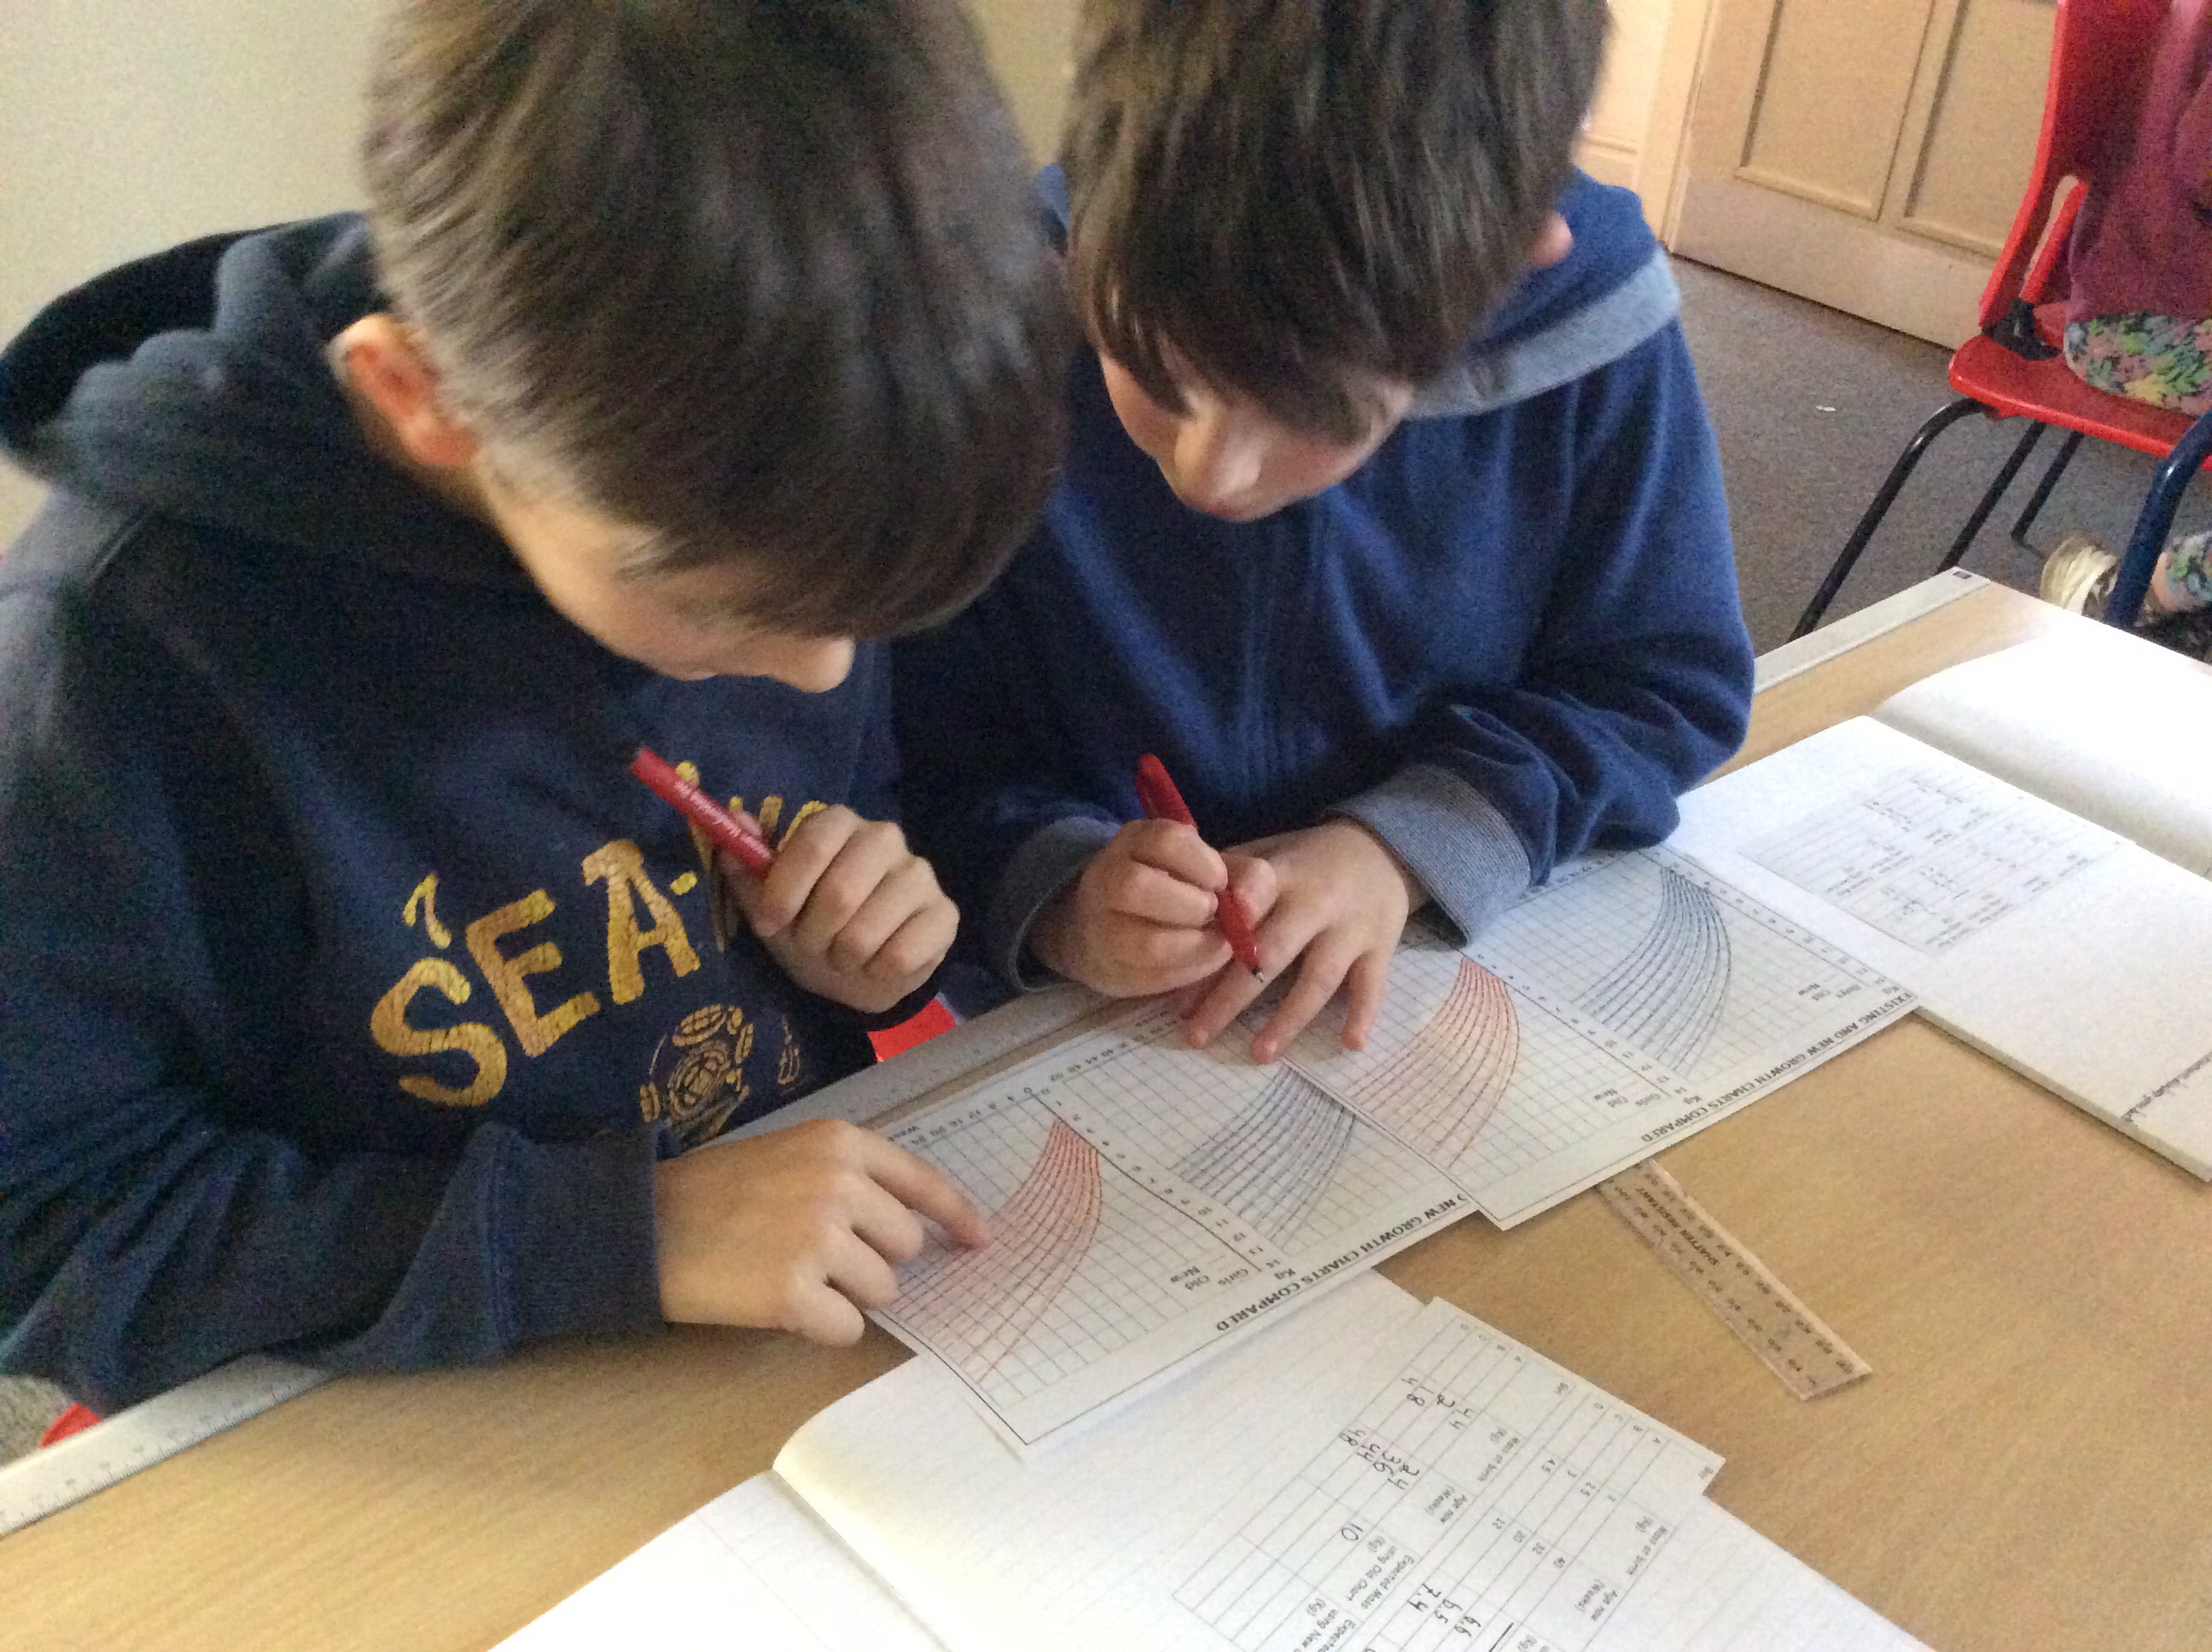
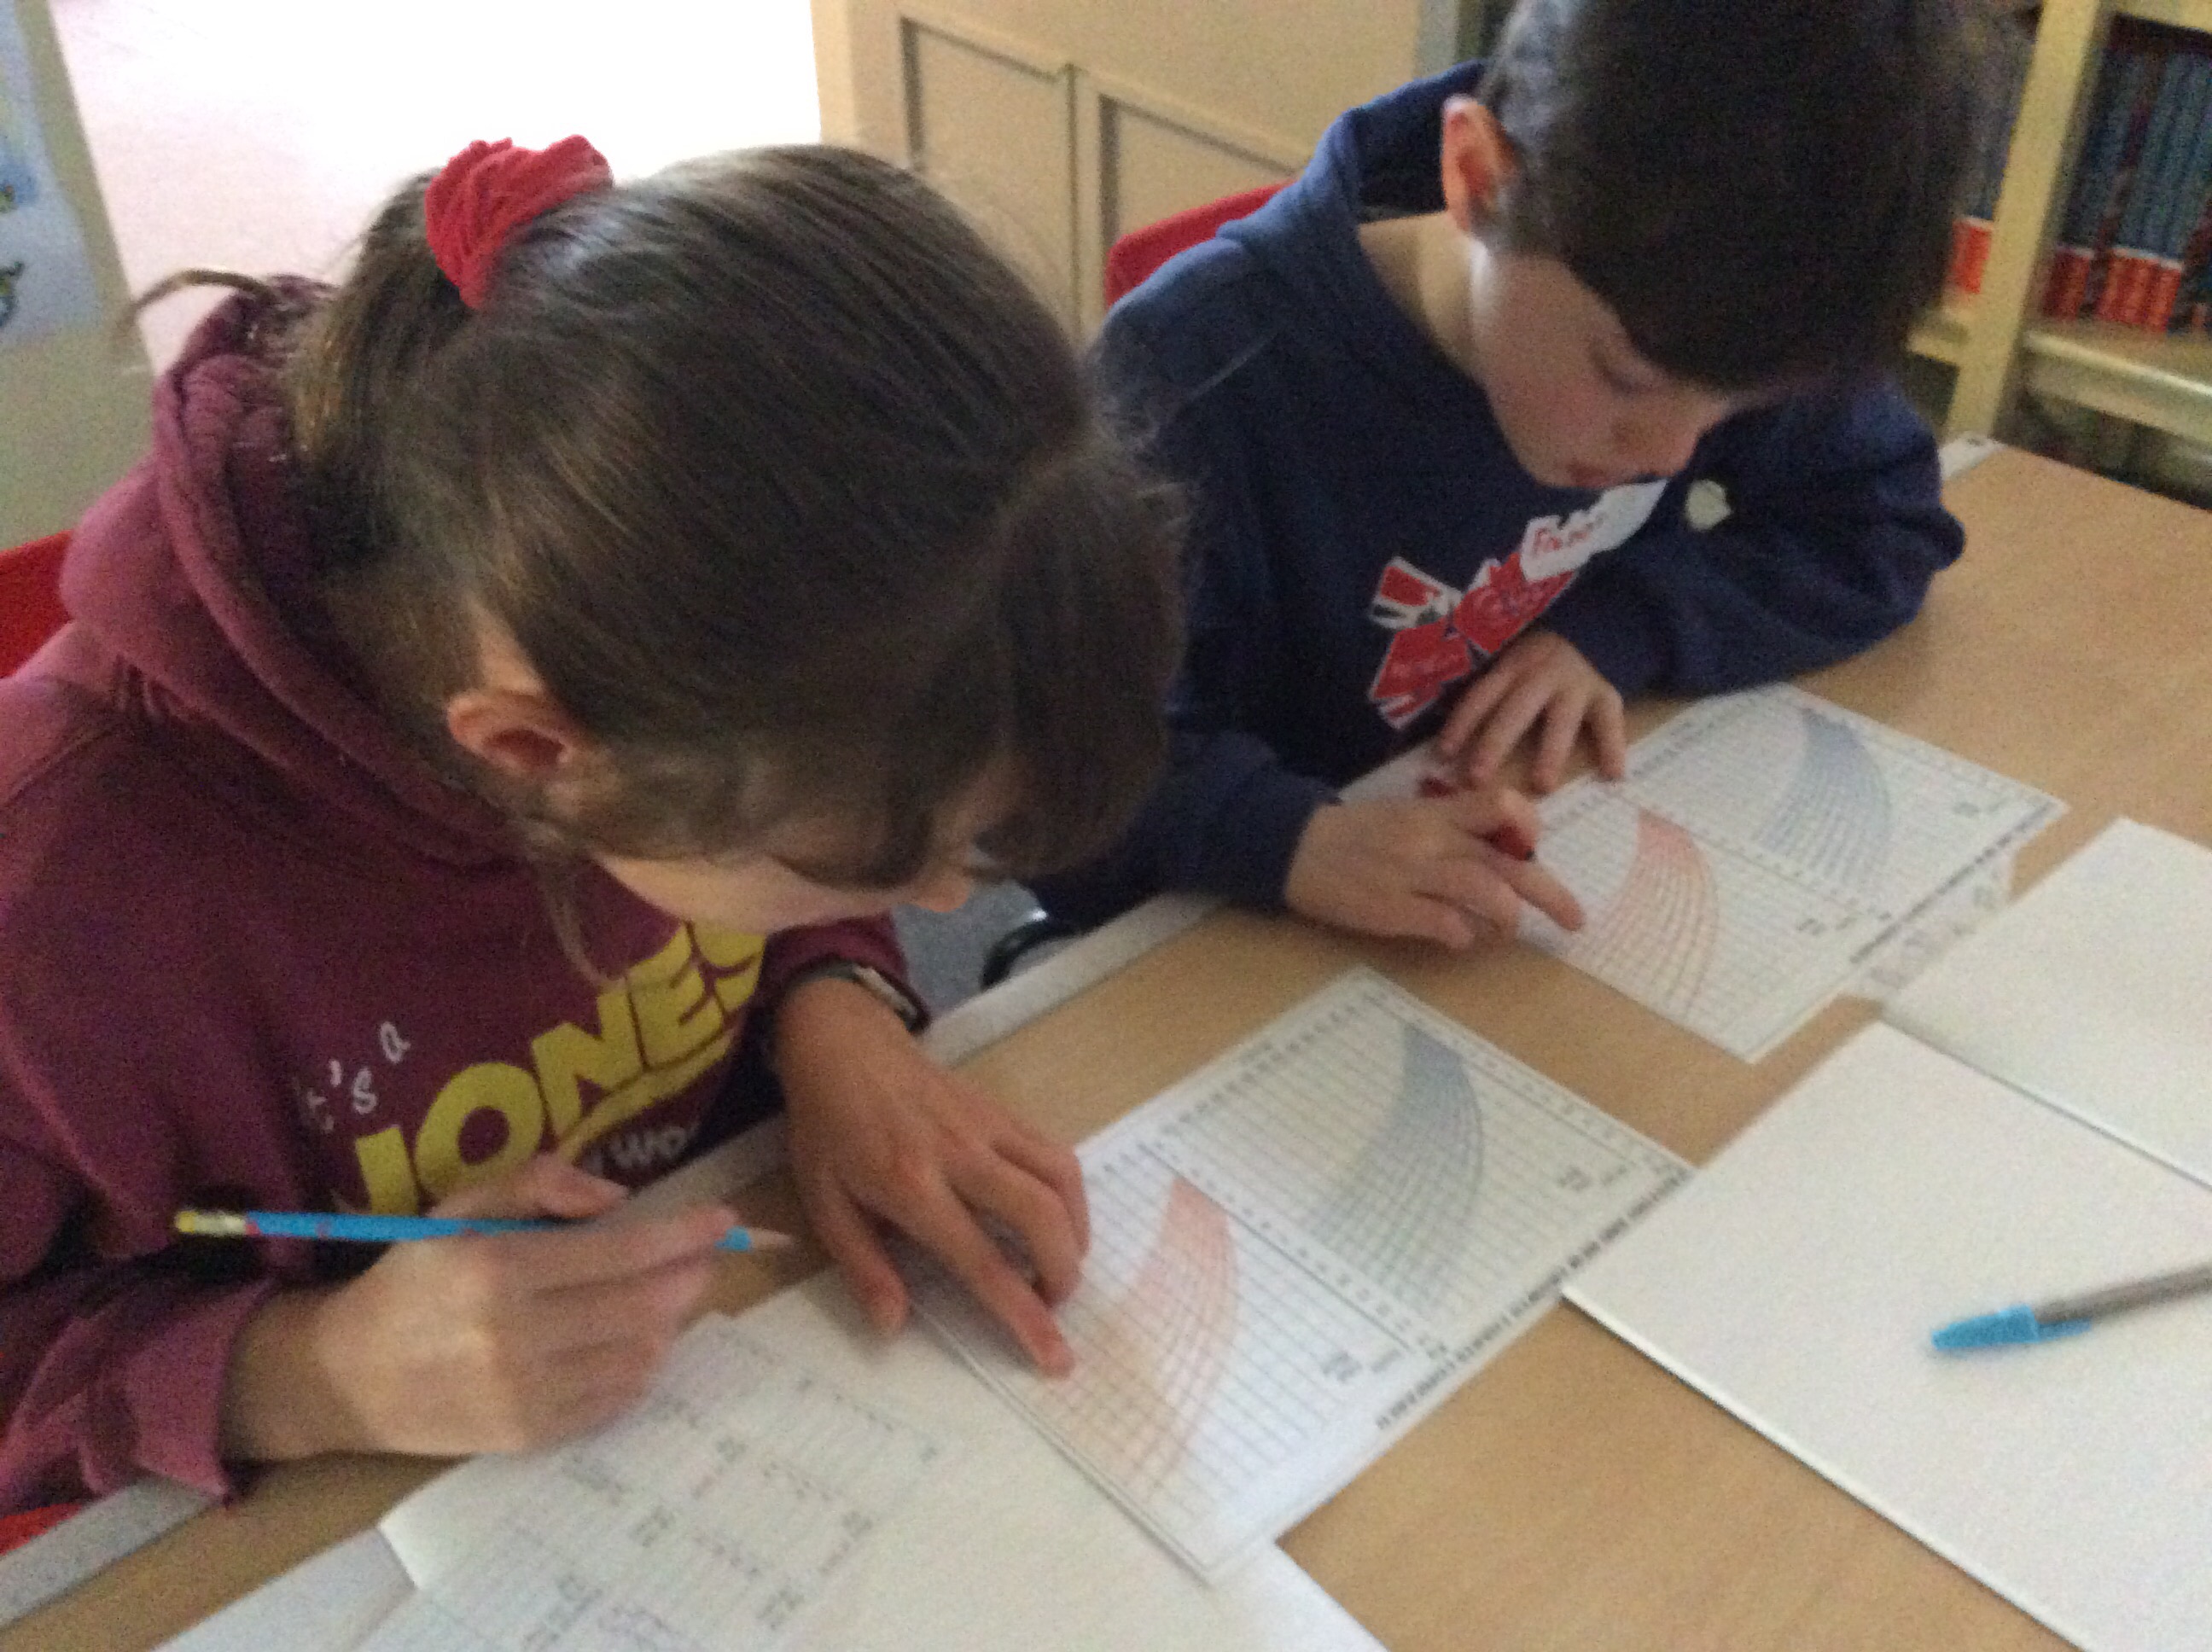
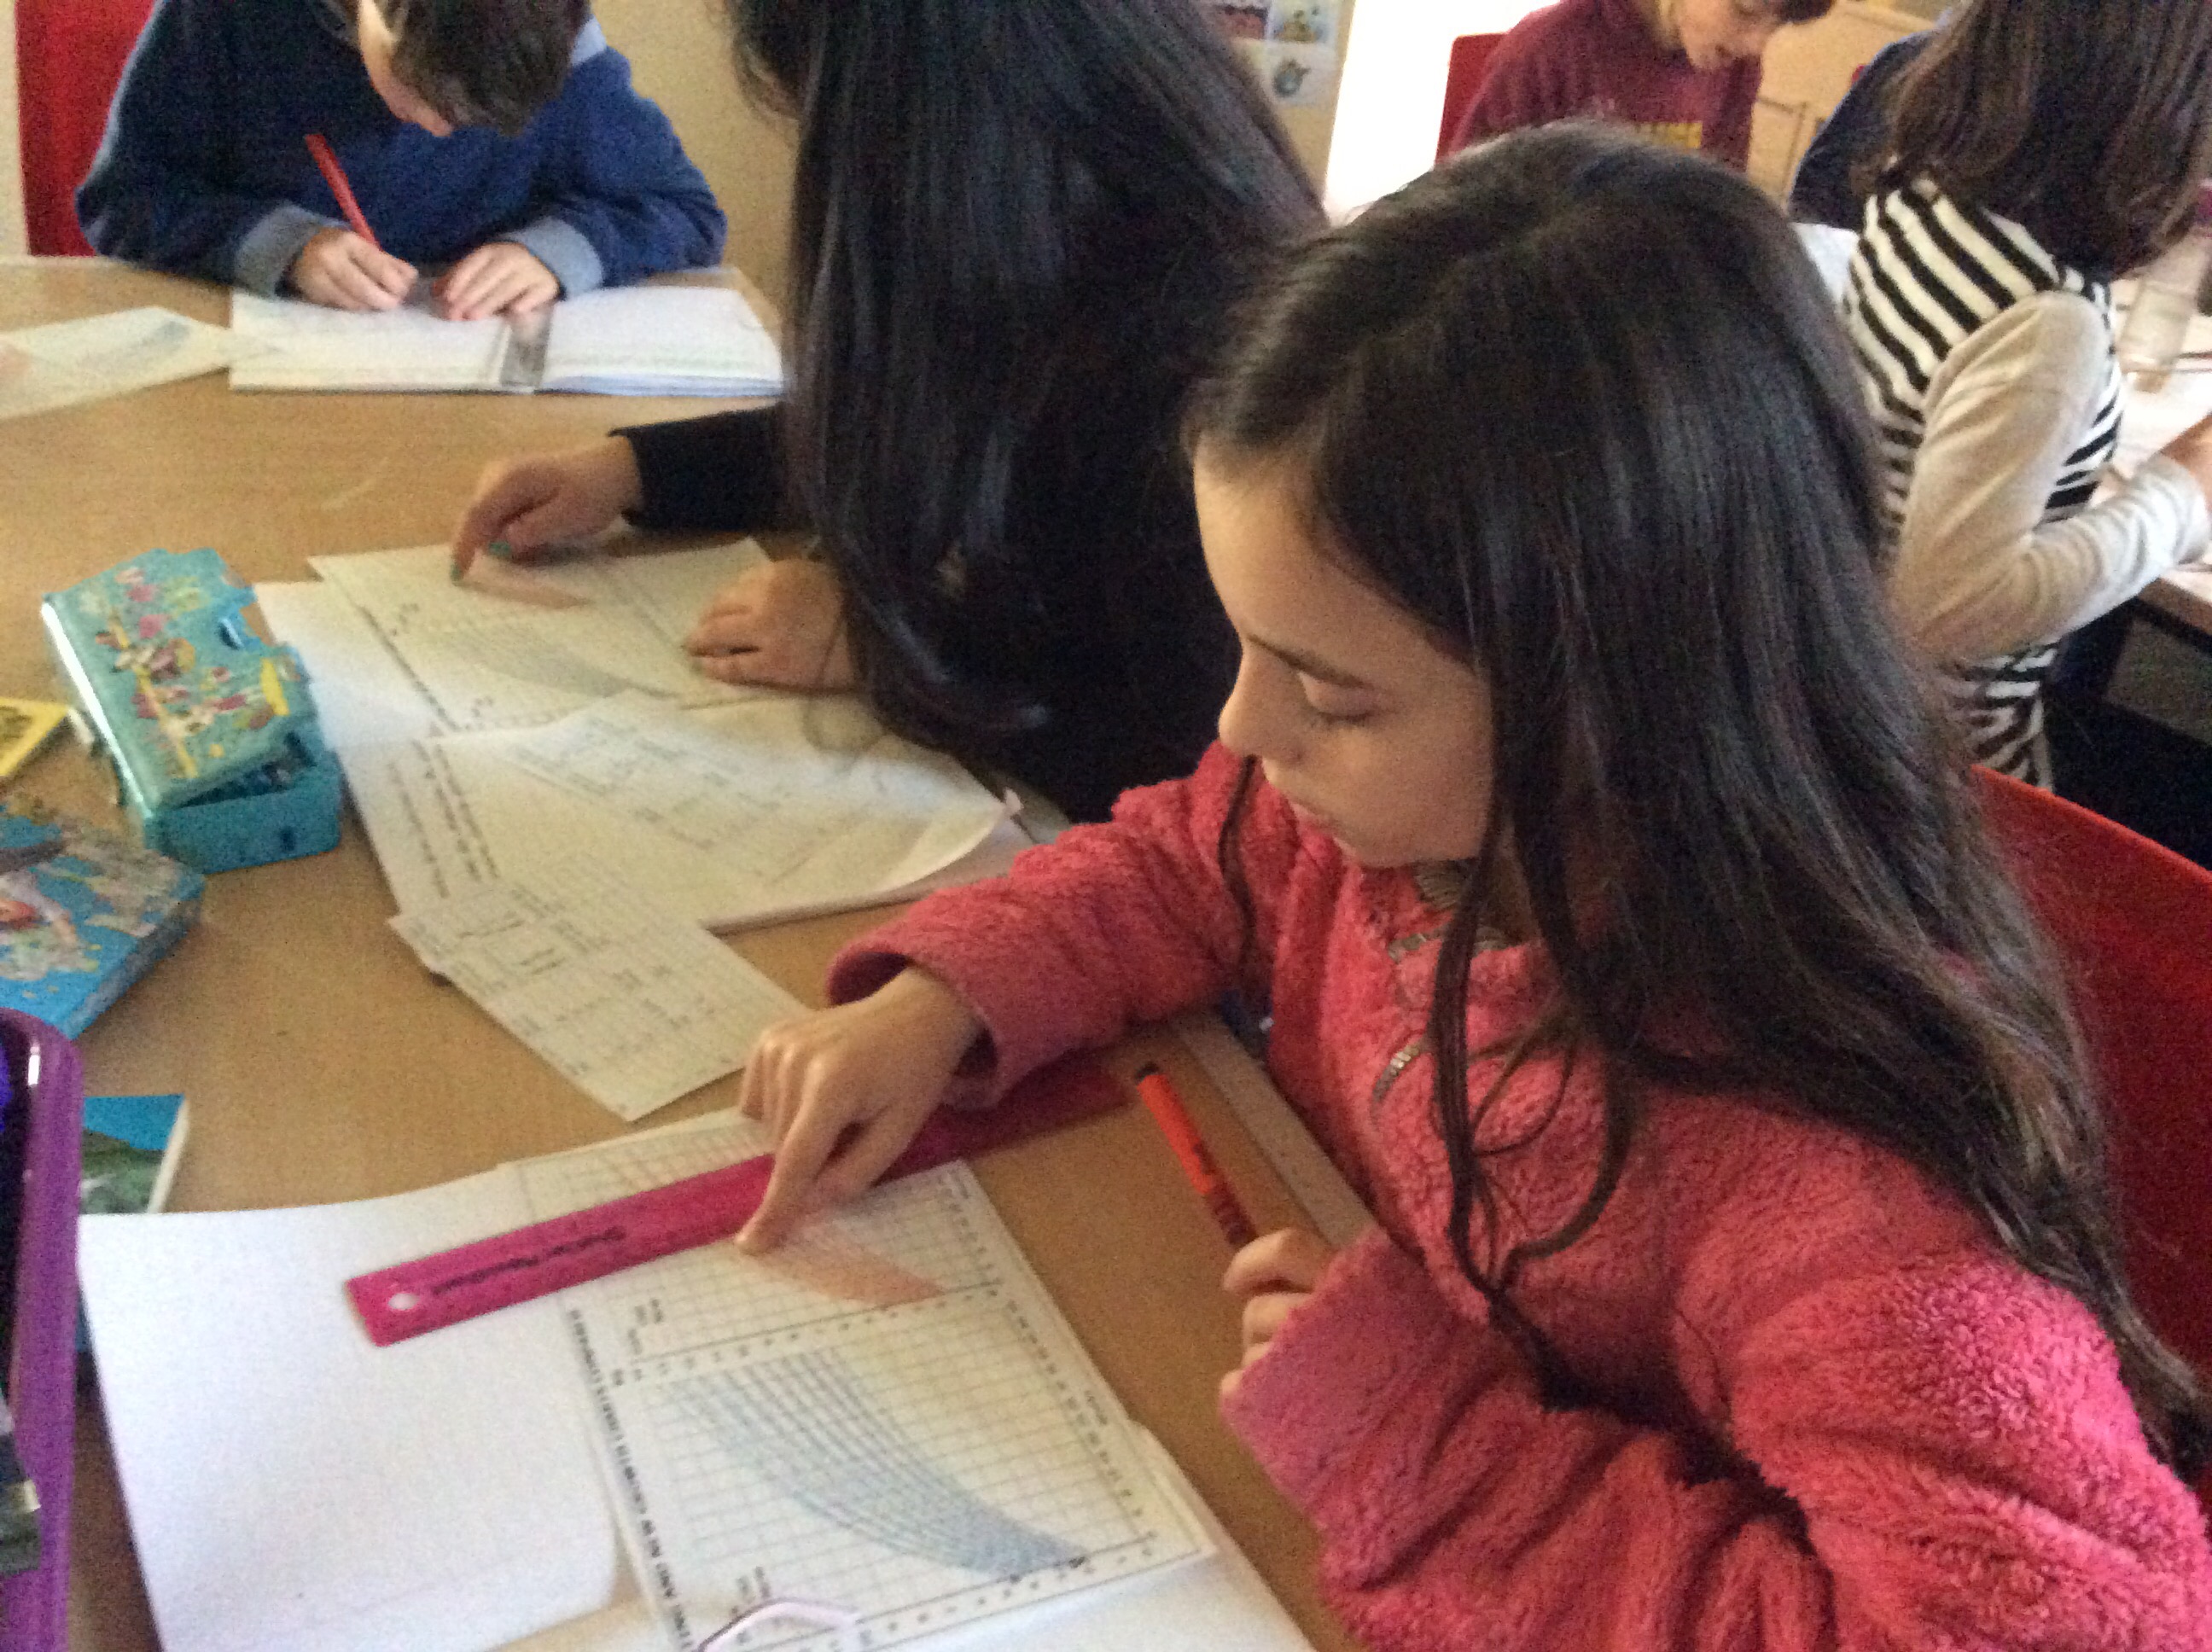
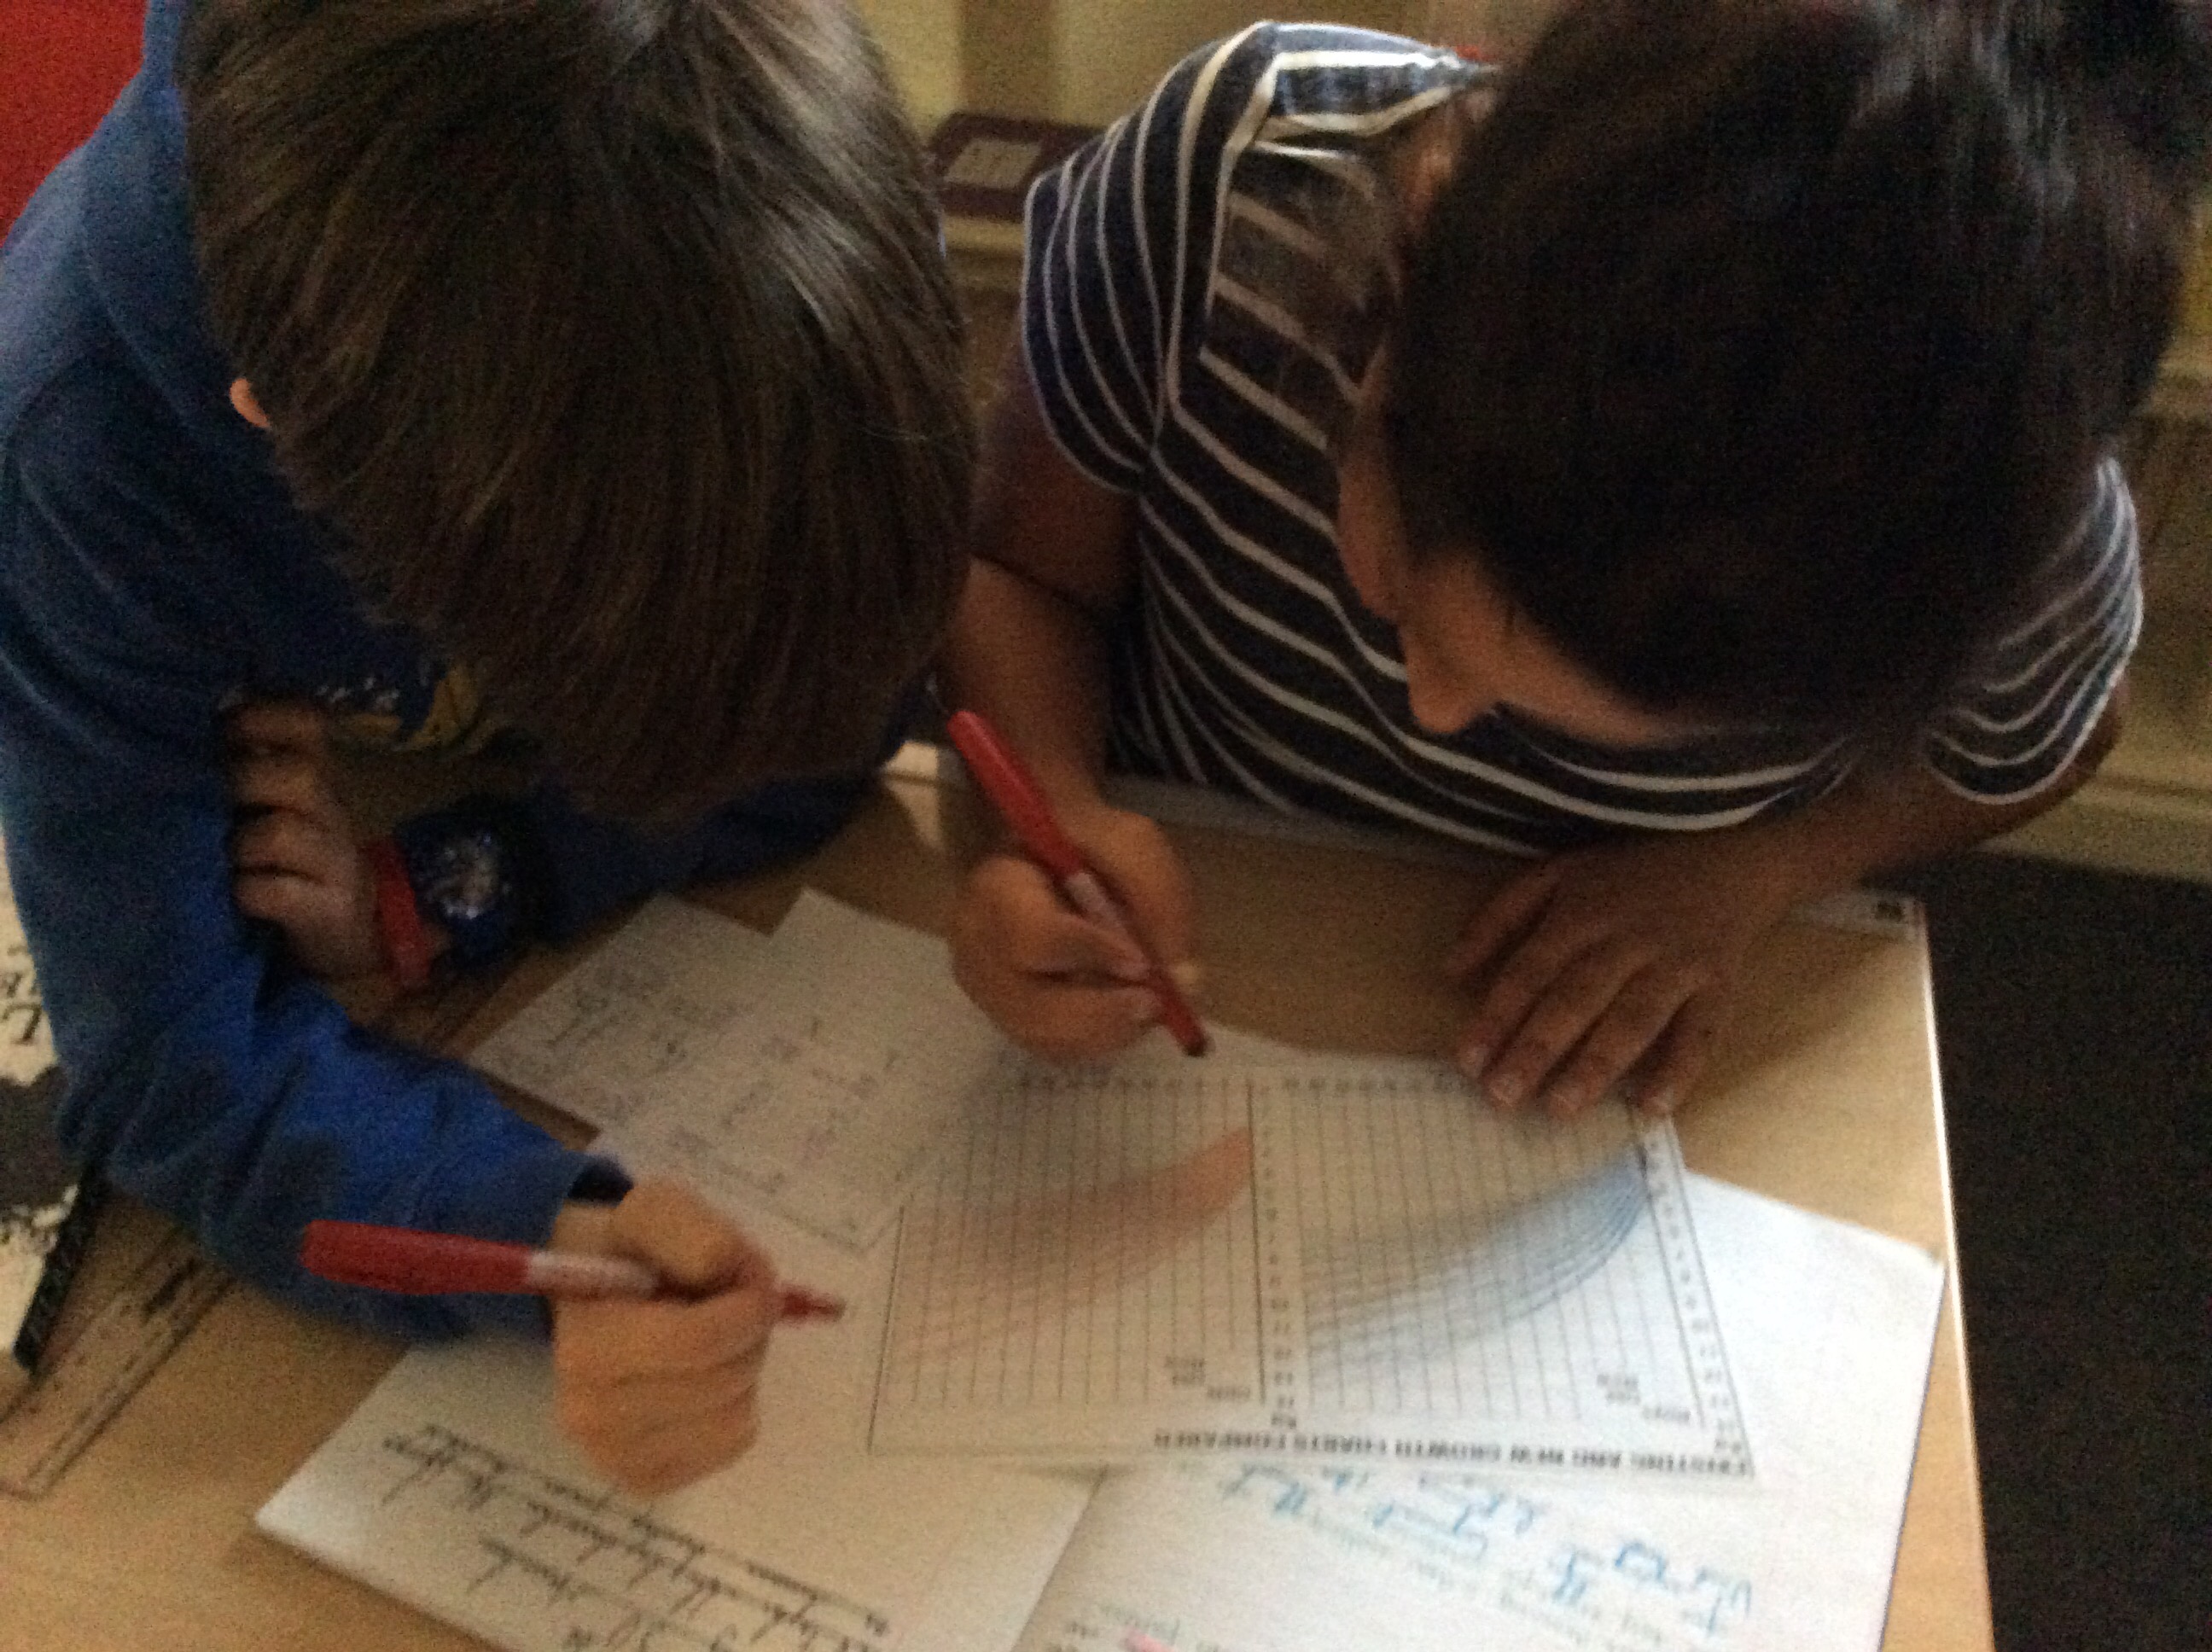
In our science lessons we have been exploring animals including humans, and today we explored some very scientific graphs showing the growths charts of boy and girl babies. We had to identify data from these graphs and complete a table comparing old and new growth rates. We had to be very precise with this and after this we then discussed our findings to draw scientific conclusions.
Class 9 – what did you find from the data? What did you think to identifying the data and looking closely to the graphs?

We found out that the babies that are new weigh more than babies that are old
This was so fun me and my partner had a lot fun ?
Babies are usually heavier when they are born than old because they are more fussy about food…
We really enjoyed it because we got to work together and think of our own problems to solve.
We really enjoyed investigating the graphs and data, it was interesting! ?We can’t wait until our next science lesson when we will find out more!
It was fairly tricky, but fun to do??????
I absoultly loved working out the graphs as it really challenged me especially the girls chart
I really enjoyed this lesson because it was a challenge.?
We found it quite confusing
I enjoyed this lesson.
This was hard at first but we got it then it was easy
It was great fun!?
I agree!
I hope we focus on graphs again in science
I didn’t really understand at first but my partner explained to me how to do it right.
I enjoyed this lesson
Me too!
And it was fun because it was a challenge
I really enjoy working with graph data!
So it combined my 1st and 3rd favourite subjects into one (Maths and Science) together!
I can’t wait to do more work in Science! And Maths!
I really enjoyed learning about it as it was science and maths
I enjoyi using graphs to find our data! However this was a tricky task to complete!