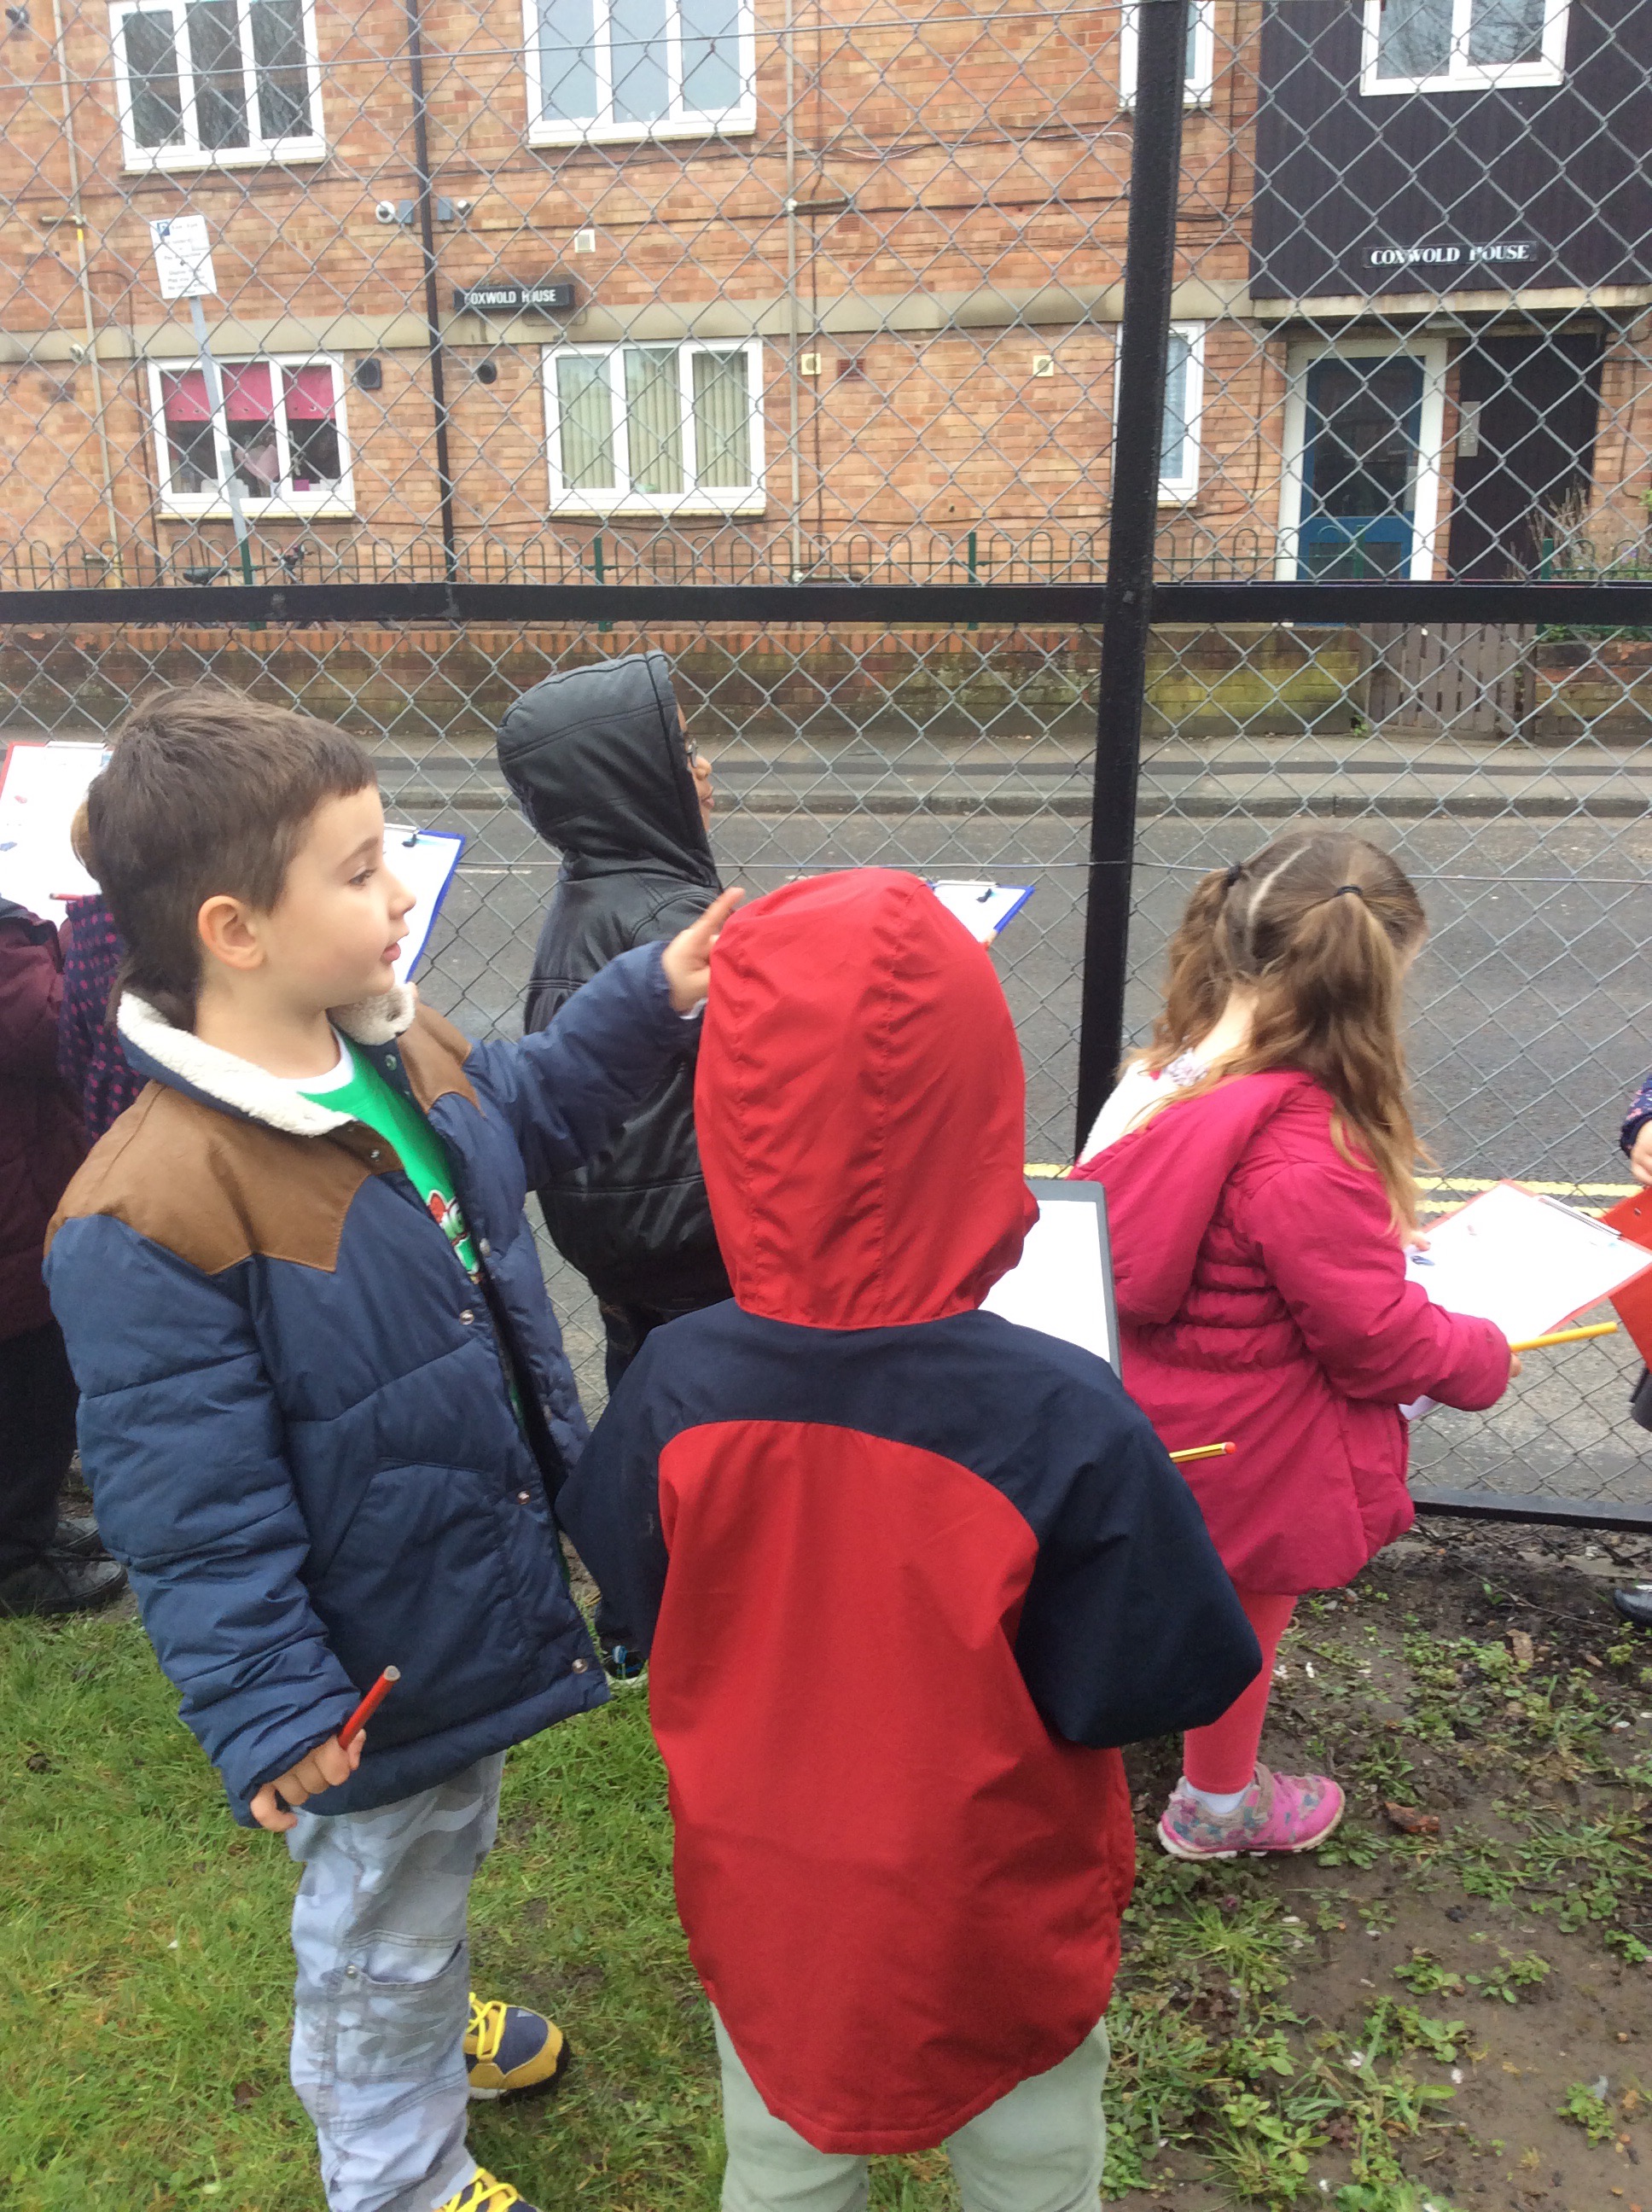
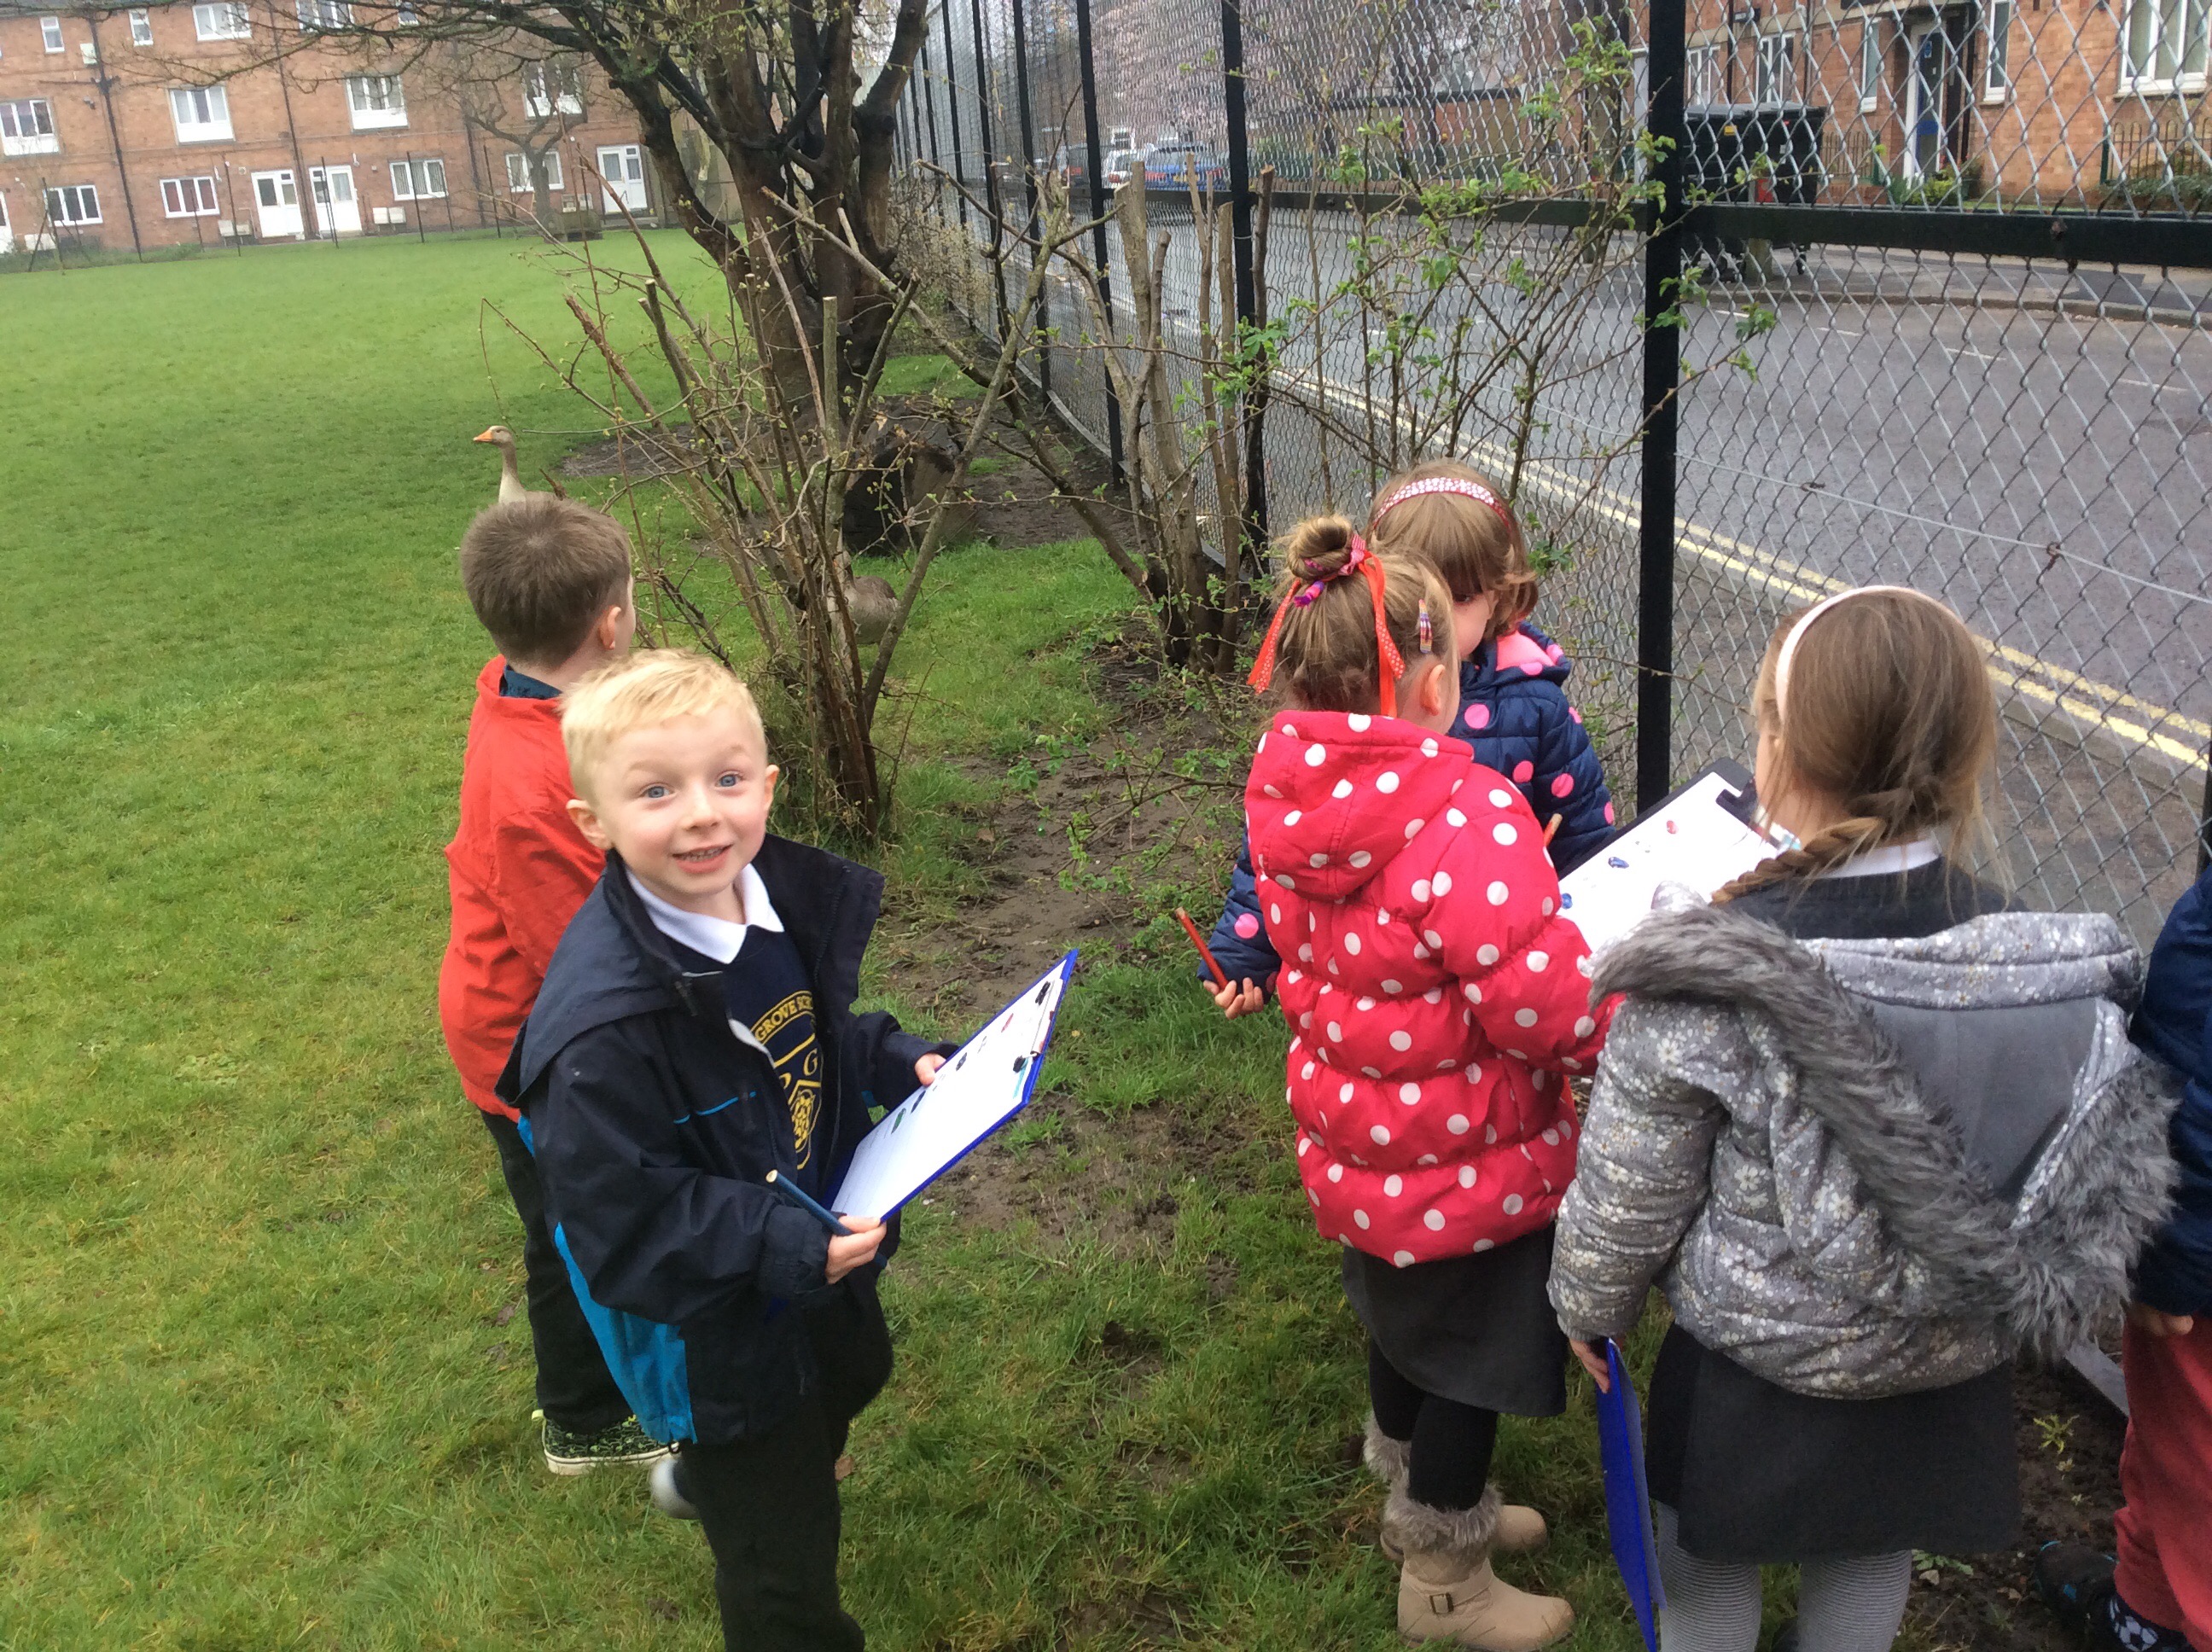
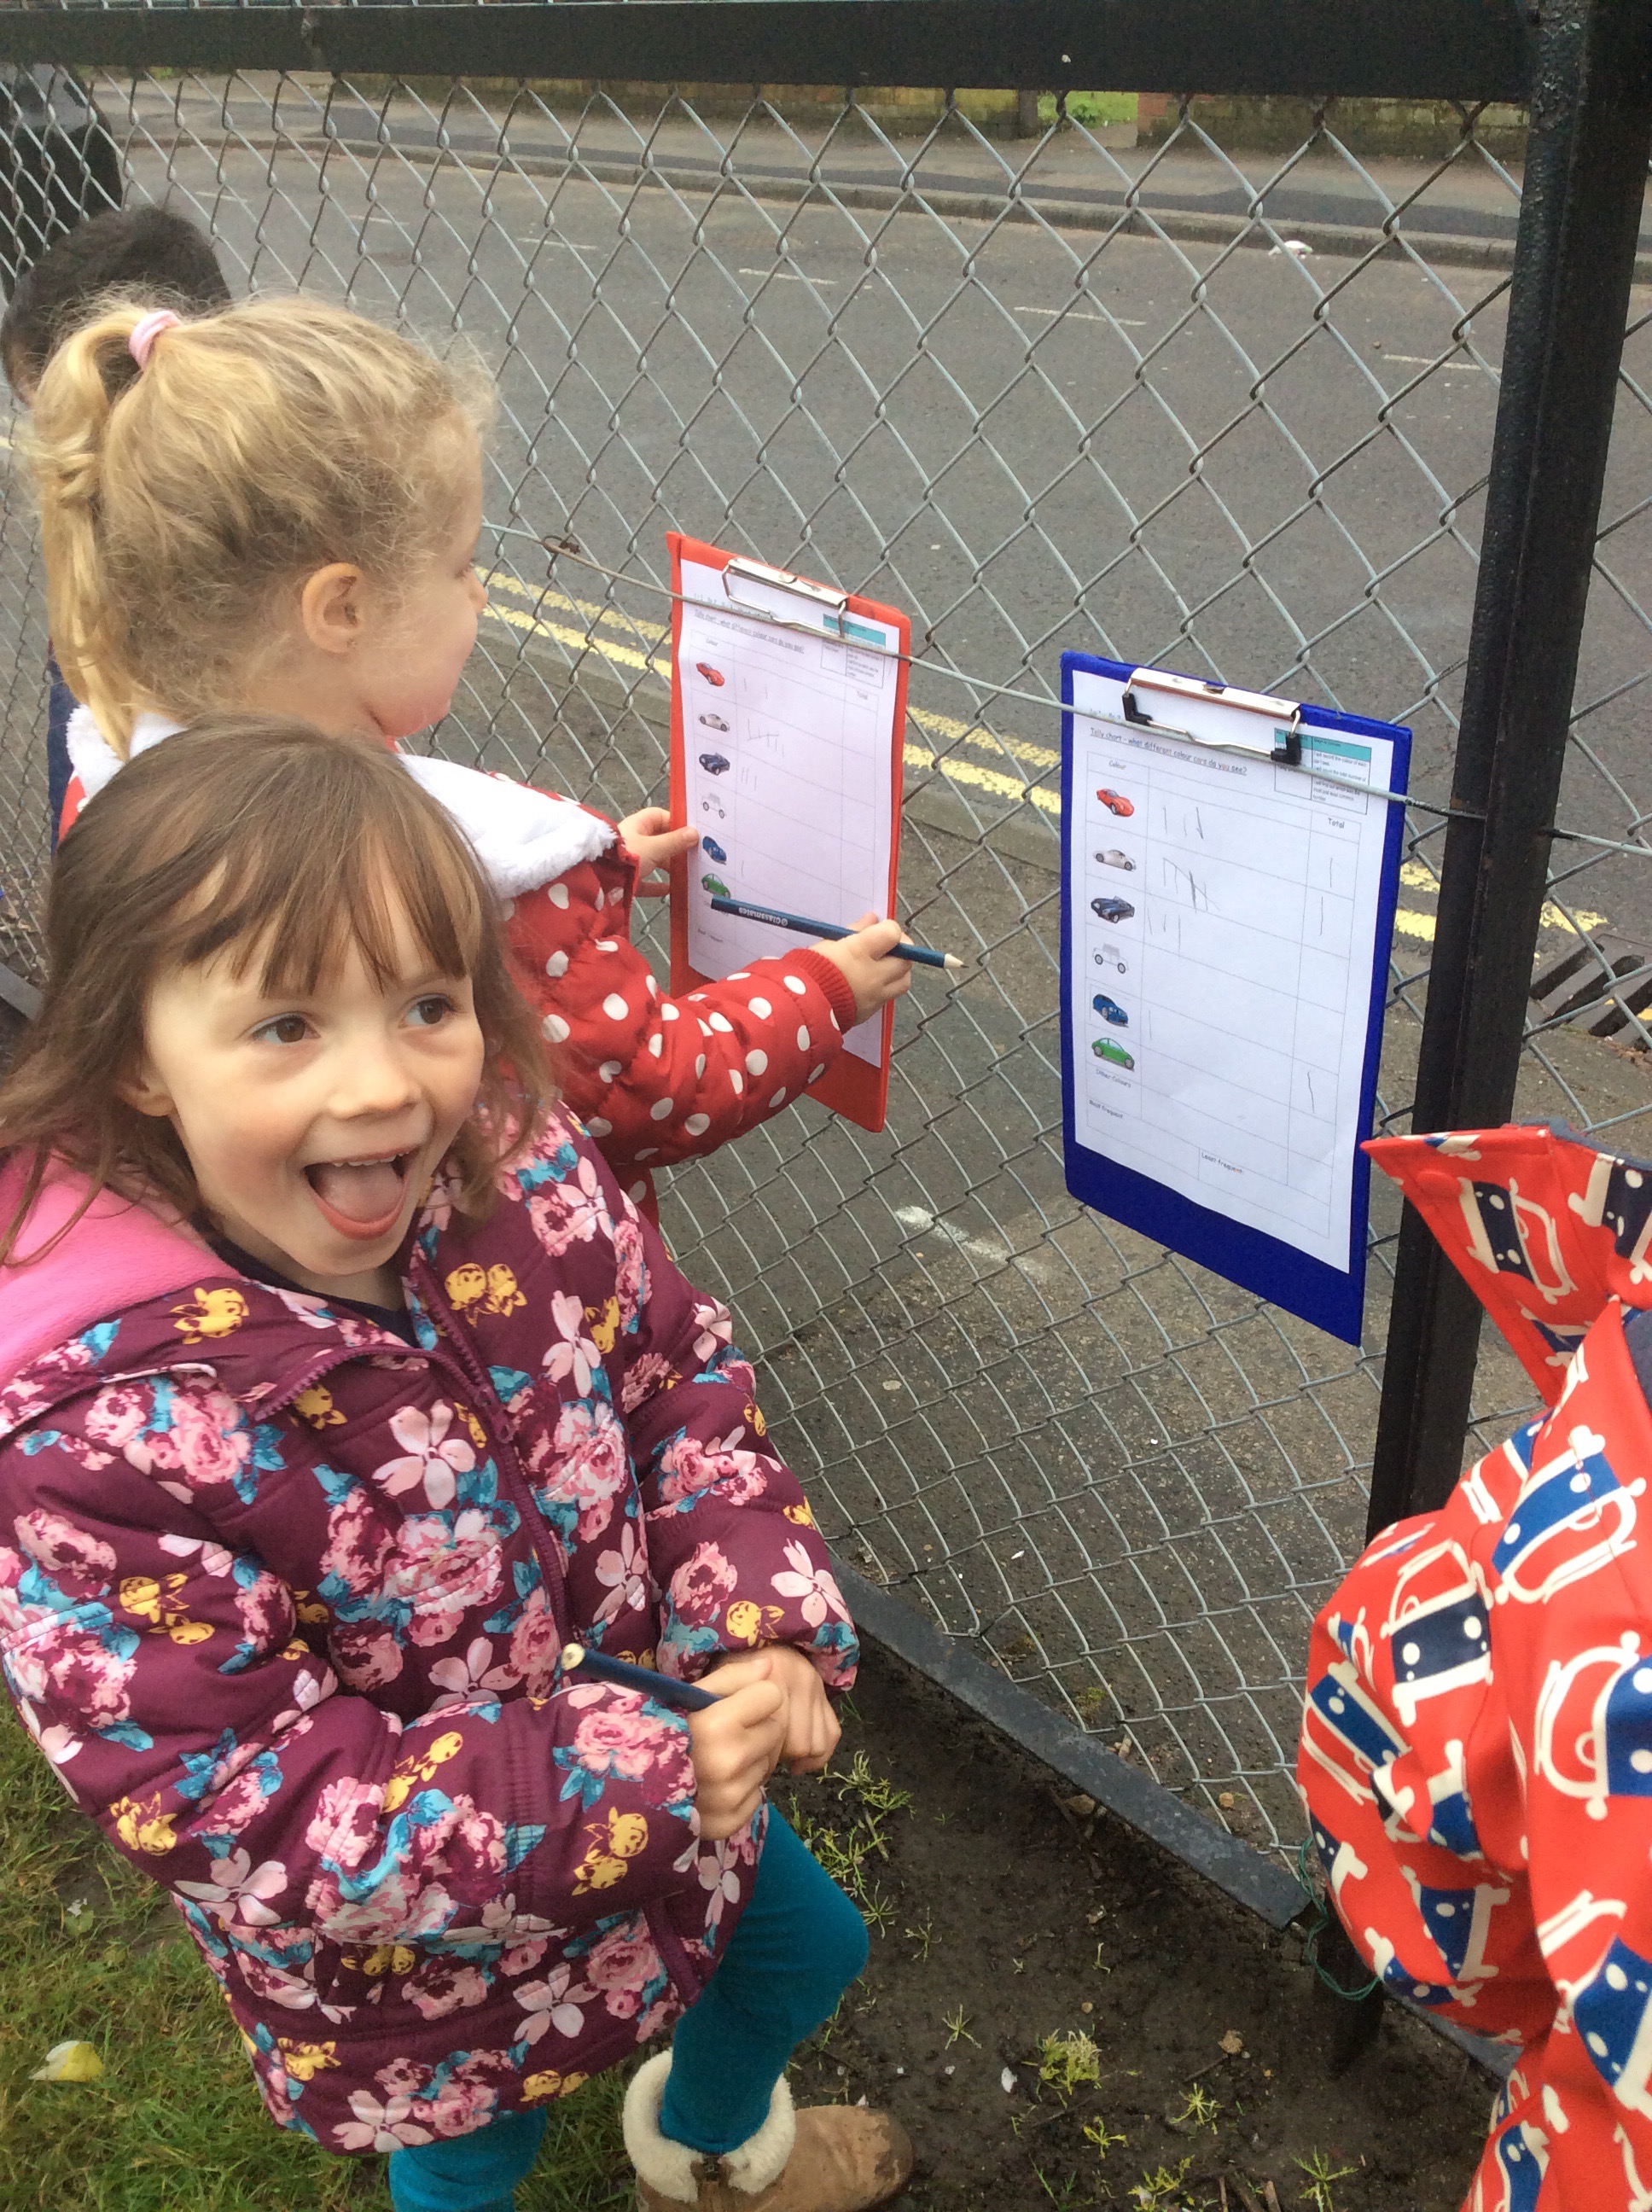
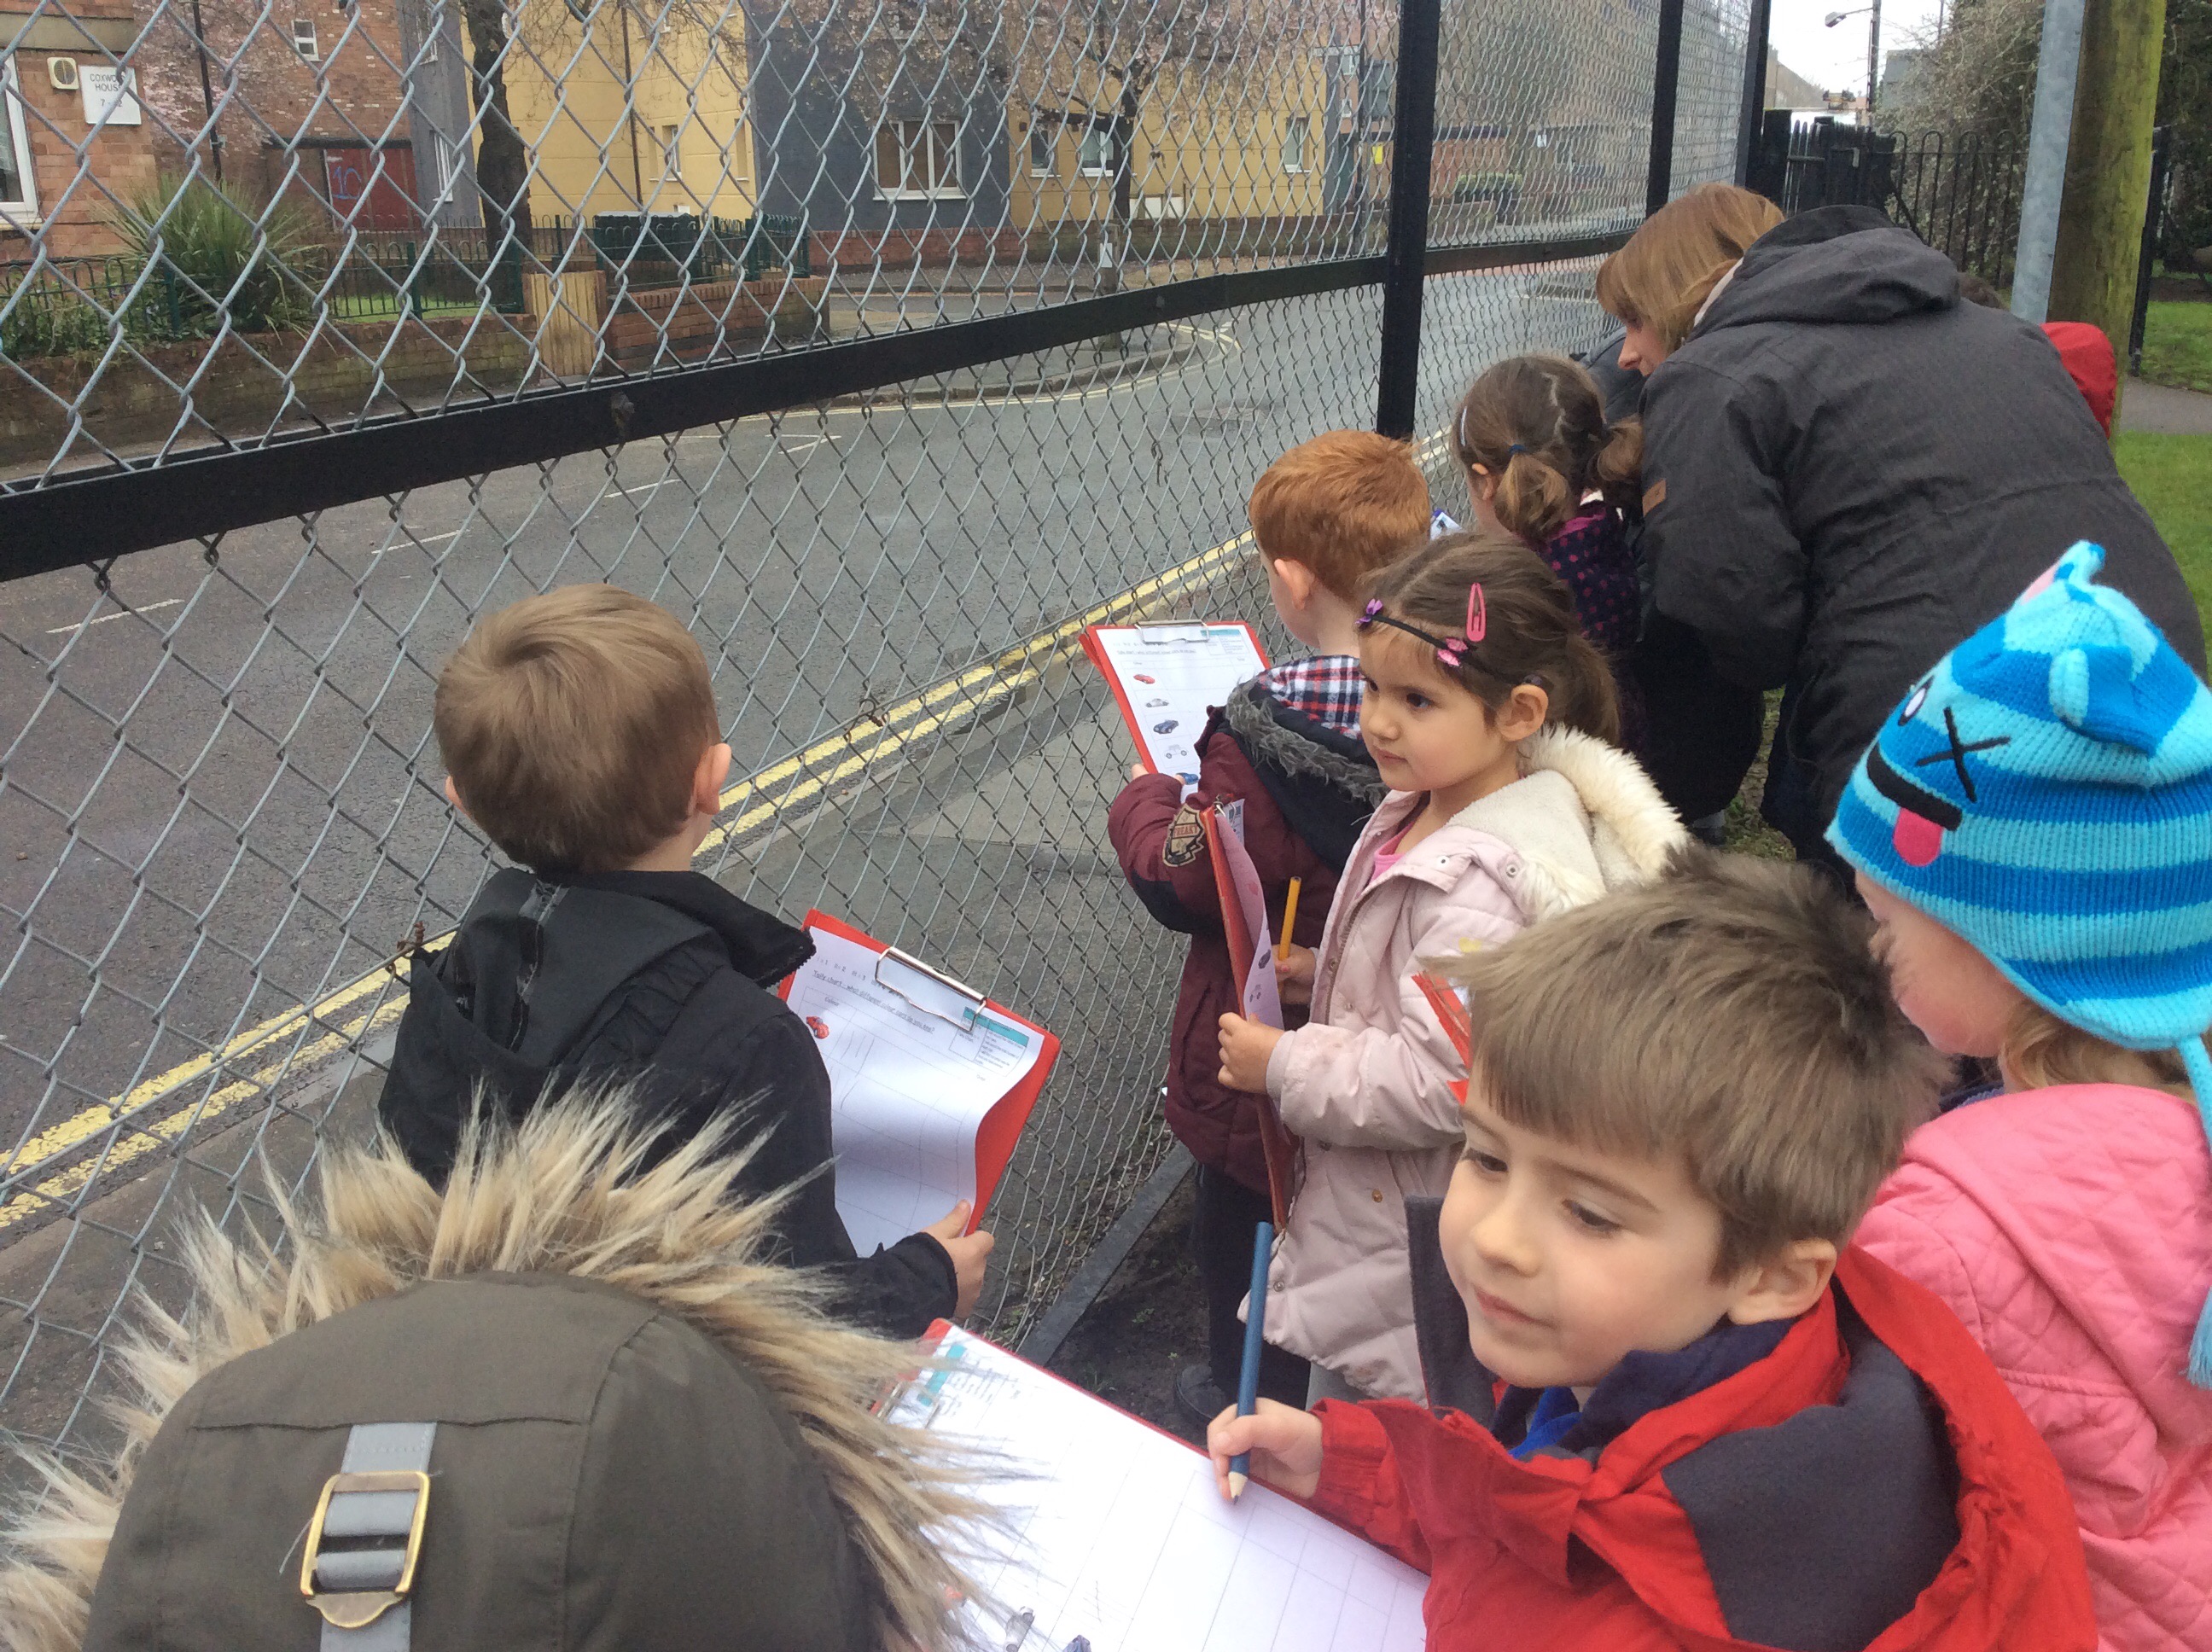
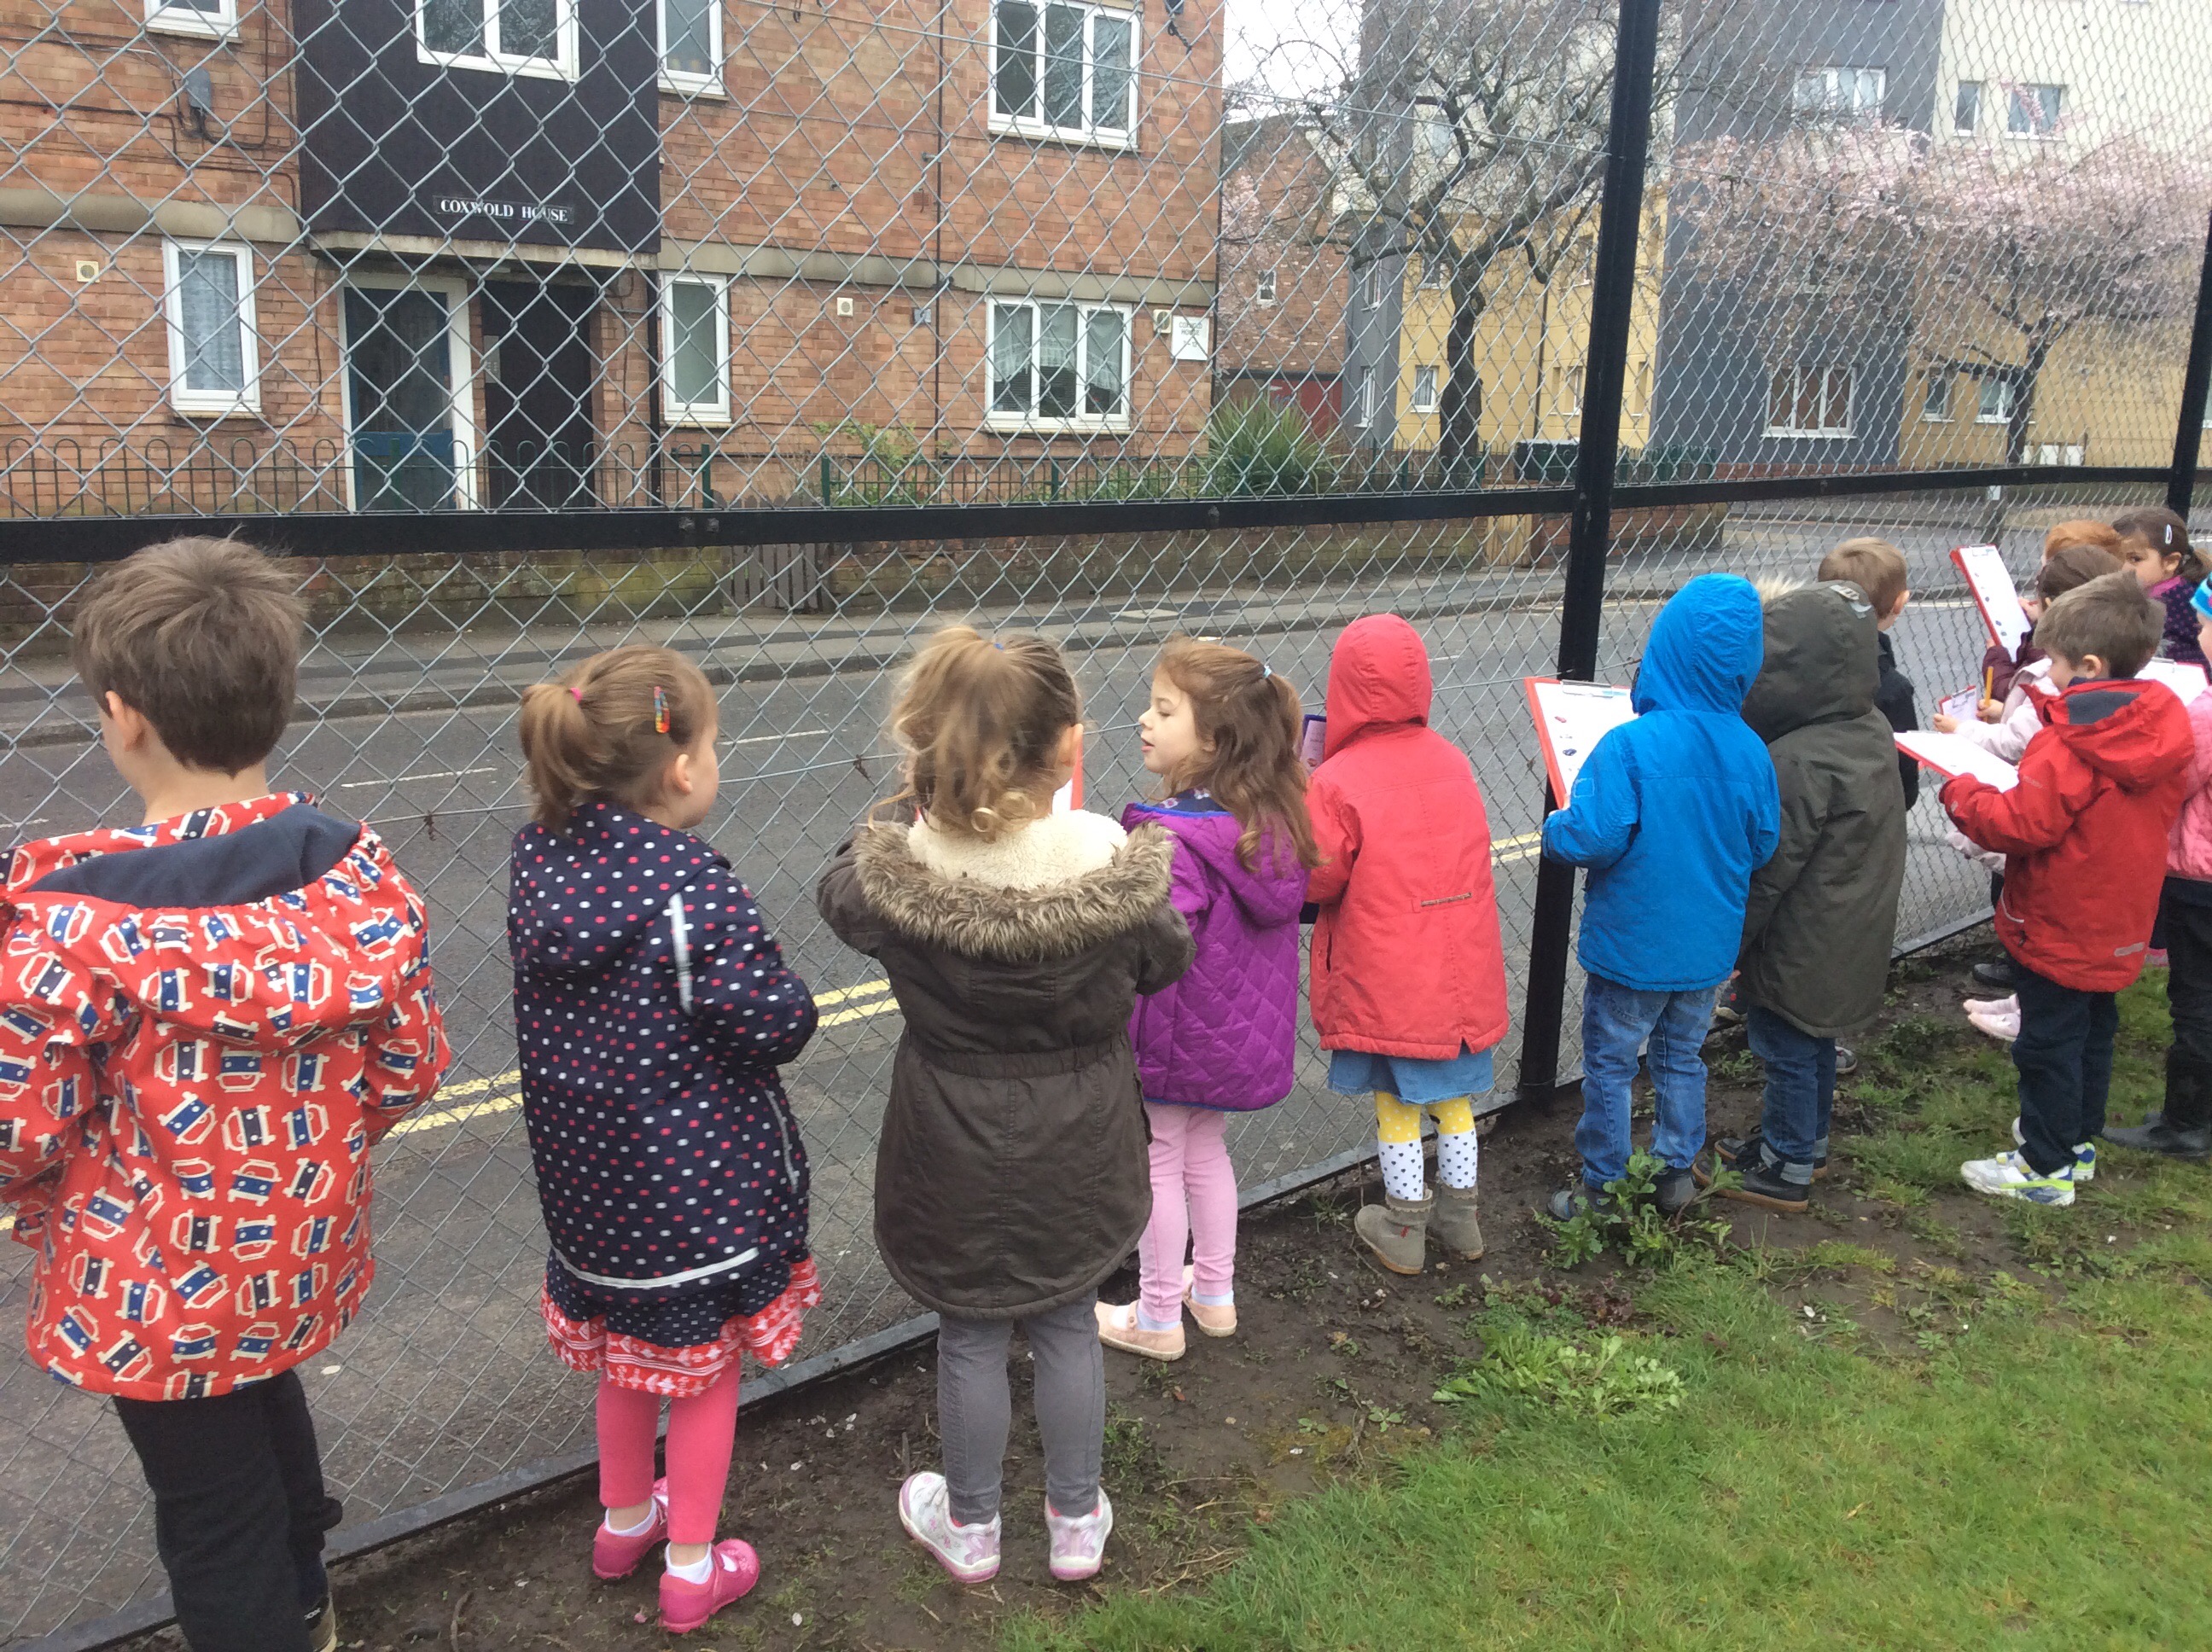
On Tuesday we made tally charts in maths. We took our clipboards down to the end of the field and counted how many of each coloured car drove past, it was very fun and the most frequent colour was silver. Later in the week we used the laptops to create a pictogram showing the different coloured cars.